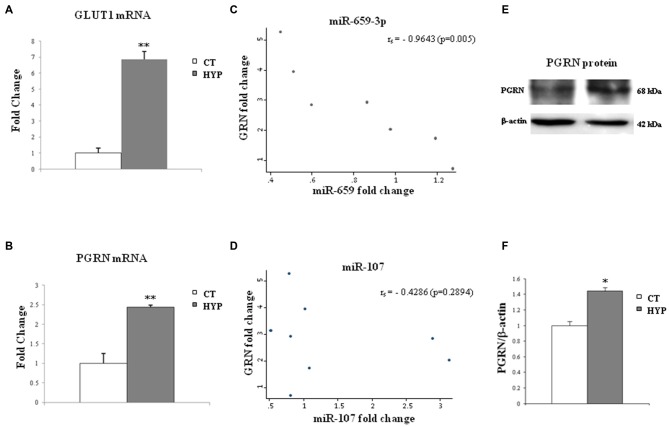
Figure 6.
Twenty-four hours of hypoxia treatment affect GLUT-1 and GRN transcripts and miR-659-3p and miR-107 expression in SK-N-BE cell lines. The histograms on the left side show mRNA levels of GLUT-1 (A) and GRN (B) after hypoxia administration. Data, compared to 18S rRNA, are expressed as fold changes relative to the control at each treatment. Mean ± SEM of six experiments is shown. In the middle, graphs show a negative correlation between GRN and miR-659-3p expression levels (C) and no correlation between GRN and miR-107 (D) in SK-N-BE. On the right side, representative Western blot analysis of PGRN protein in normoxic and hypoxic conditions (E,F). Expression of Western Blot was normalized on β-actin expression. Mean ± SEM of four experiments is shown. **p < 0.01 and *p < 0.05 vs. untreated normoxic cells.

