Figure 4.

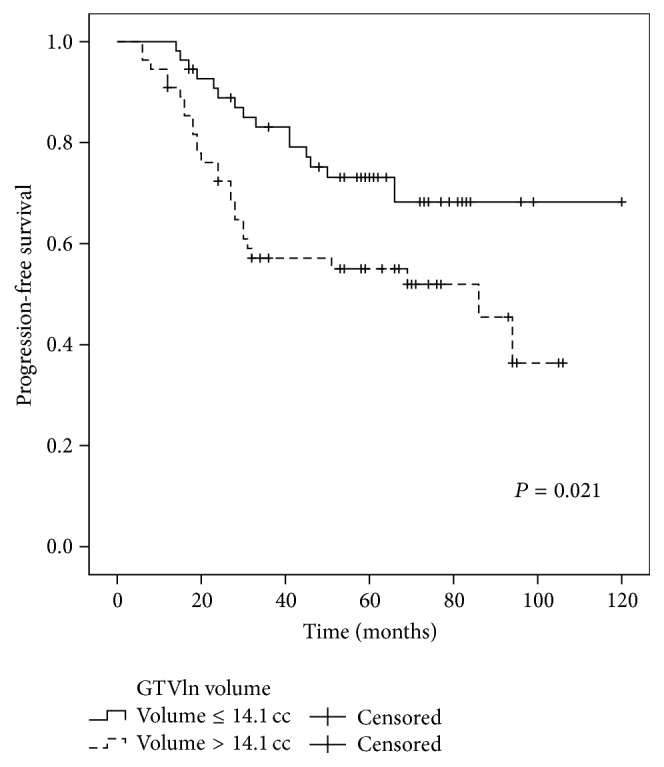
Comparison of the 5-year PFS curves for the patients with a GTVln ≤ 14.1 cc versus a GTVln > 14.1 cc. Log-rank test; P = 0.021.

Comparison of the 5-year PFS curves for the patients with a GTVln ≤ 14.1 cc versus a GTVln > 14.1 cc. Log-rank test; P = 0.021.