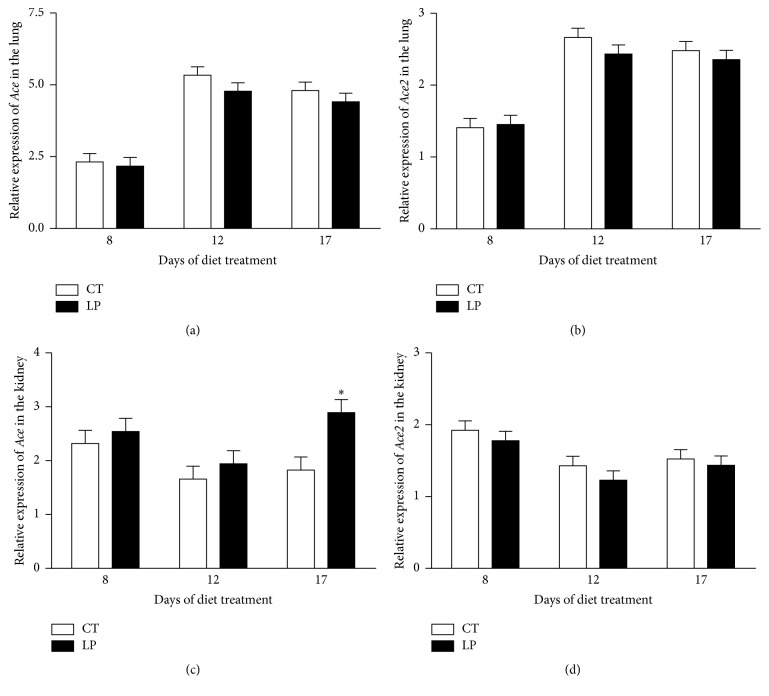
Figure 2.
Quantitative real-time PCR analysis of Ace and Ace2 in the lung ((a), (c)) and kidney ((b), (d)) of nonpregnant rats fed a low-protein diet. CT: control; LP: low protein. The error bar represents the mean ± SEM expressed as relative units of mRNA standardized against R18s (n = 6 rats/diet group/day). ∗ P < 0.05.

