
Figure 10.
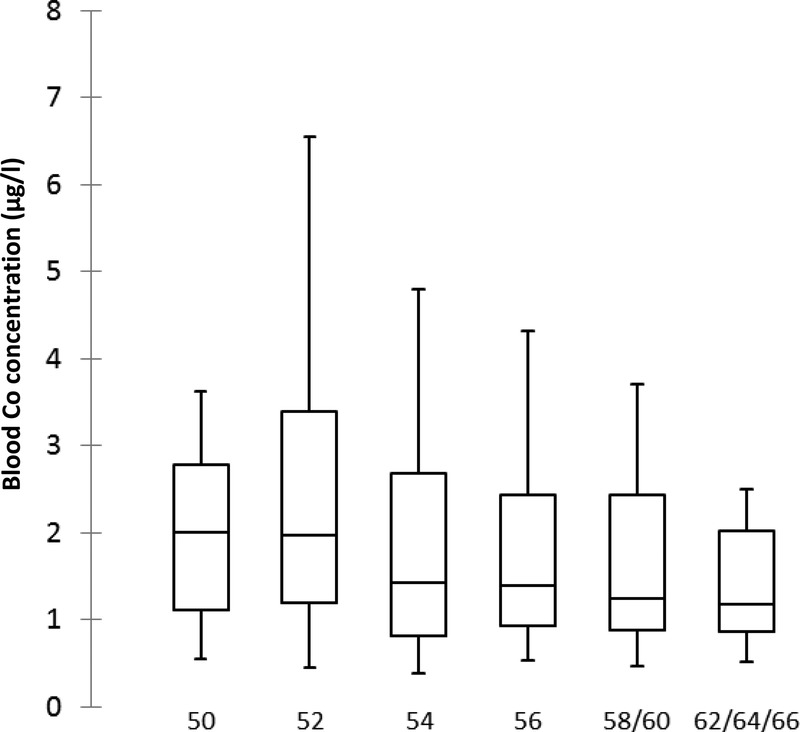
In this box and whisker chart, unilateral patients were grouped according to liner sizes and the blood Co distributions plotted (blood Co concentrations measured in µg/L).
Official websites use .gov
A
.gov website belongs to an official
government organization in the United States.
Secure .gov websites use HTTPS
A lock (
) or https:// means you've safely
connected to the .gov website. Share sensitive
information only on official, secure websites.
In this box and whisker chart, unilateral patients were grouped according to liner sizes and the blood Co distributions plotted (blood Co concentrations measured in µg/L).