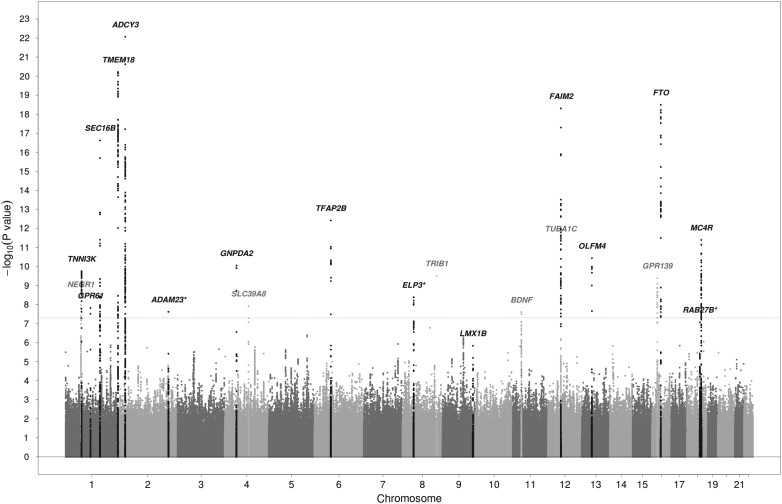
Figure 1.
Manhattan plot of results of the discovery meta-analysis of 20 studies. Chromosomes are shown on the x-axis, the –log10 of the P-value on the y-axis. The gray dotted line represents the genome-wide significance cutoff of 5 × 10⁻⁸. Genes shown in black are the known loci that were significantly associated with childhood BMI in the joint discovery and replication analysis. Genes shown in gray were significant in the discovery, but not in the joint discovery and replication analysis. *indicates novel loci that were significantly associated with childhood BMI in the joint discovery and replication analysis. See also Table 1.

