
FIGURE 2.
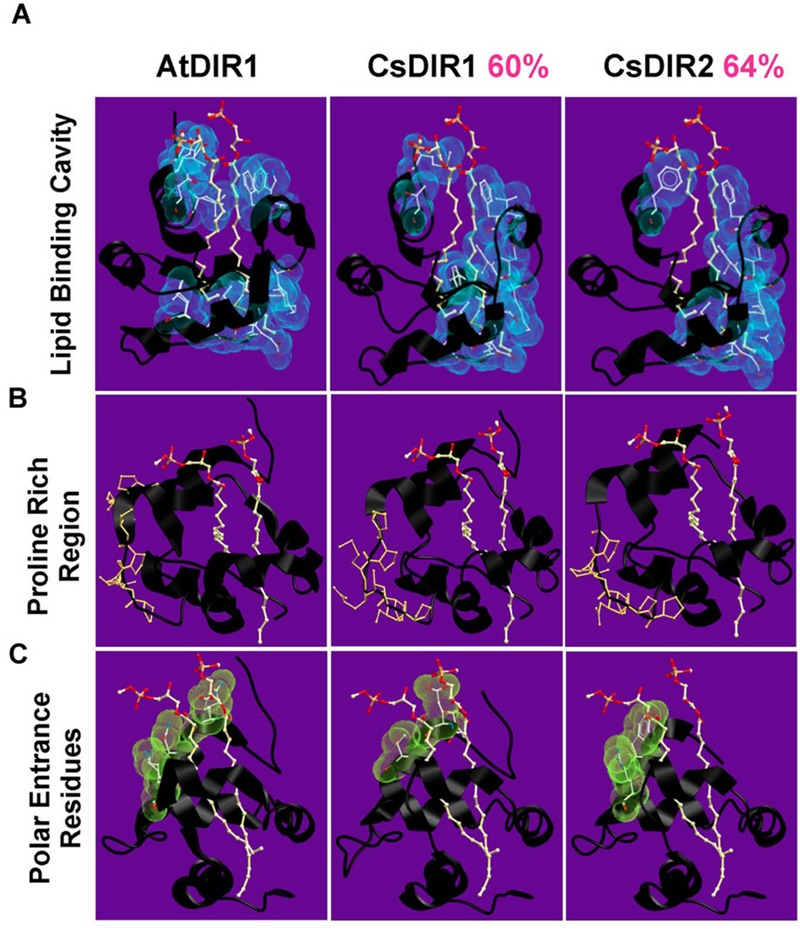
Homology models of CsDIR1 and CsDIR2. Proteins were modeled with SWISS-MODEL 4.0.1 server using AtDIR1-phospholipid crystal structure as a template and modeled with SWISS-MODEL 4.0.1 server and viewed using Molsoft ICM browser. Percent sequence similarity compared to AtDIR1 is identified in pink. (A–C) phospholipids in orange (phosphate), red (oxygen), and white (carbon). (A) The hydrophobic residues (blue) that are within 5 Å of the phospholipids highlight the inner hydrophobic cavity. (B) The proline residues of the proline rich regions are highlighted in orange. (C) The polar residues at the cavity entrance are highlighted in green.