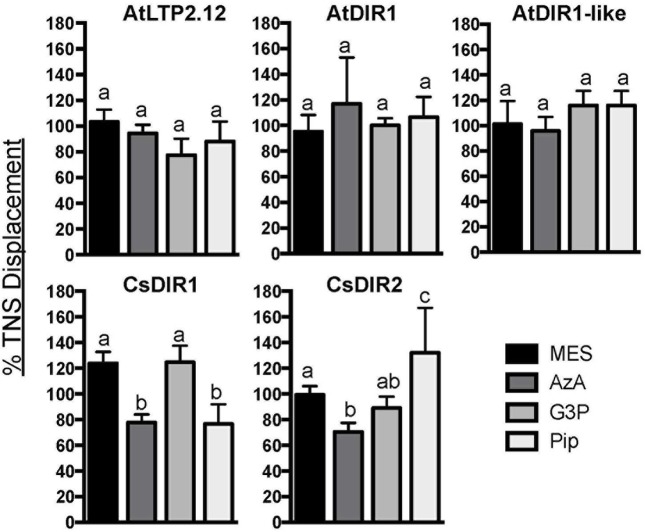
FIGURE 6.
In vitro ligand binding assays. TNS displacement assays using AtDIR1, AtLTP2.12, AtDIR1-like, CsDIR1, and CsDIR2 to test the binding of azelaic acid (AzA), glycerol-3-phosphate (G3P), pipecolic acid (Pip), and MES buffer control. Fluorescence was measured when TNS (3 μm) and putative ligands (16 μm) were incubated together for 3 min, then again after purified proteins were added. Fluorescence was measured at excitation wavelength of 320 nm and emission at 437 nm in triplicate. The data is represented as the percent TNS Displacement, which indicates the fluorescence level of protein-ligand-TNS compared to TNS-protein alone (100%). Error bars indicate standard deviation of three replicate measurements. Different letters indicate significant differences (ANOVA, Tukey’s HSD, p < 0.05).

