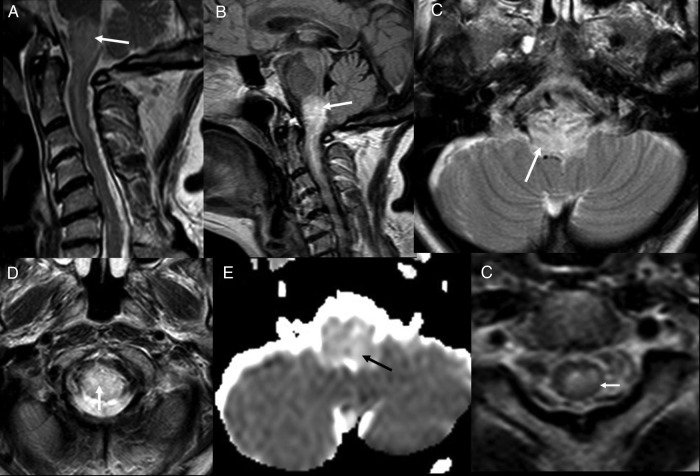
Figure 1.
Initial MRI. T2 sagittal (A), FLAIR sagittal (B) and T2 axials (C and D) show presence of oedema in medulla and upper cervical cord (white arrow). ADC map (E) shows high ADC value suggestive of vasogenic oedema (black arrow). T2 axial (F) though upper cervical cord showing low peripheral T2 signal (white arrow). FLAIR, fluid attentuated inversion recovery; ADC, apparent diffusion coefficient.

