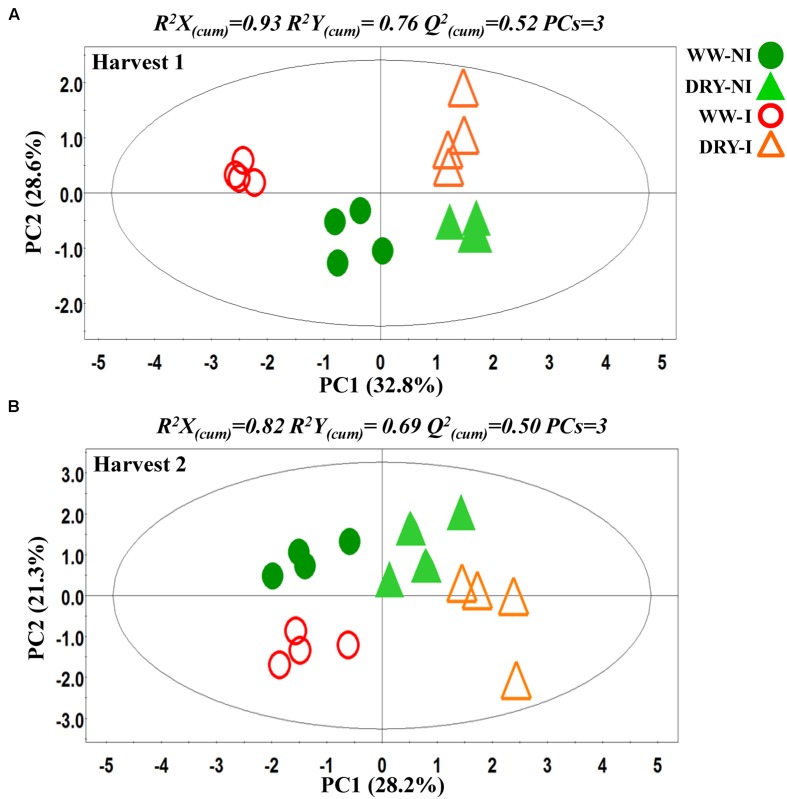
FIGURE 5.
Partial least squares-discriminant analyses (PLS-DA) PC1/PC2 score plots for (A) harvests 1 (H1) and (B) harvest 2 (H2). The ellipse represents the Hotelling T2 with 95% confidence interval. Four biological replications each consisting of ten plants were performed per treatment [Q(cum)2; cumulative fraction of the total variation of the X’s that can be predicted by the extracted components, R2X and R2Y; the fraction of the sum of squares of all X’s and Y’s explained by the current component, respectively]. WW; well-watered, DRY; dry, NI; no inoculation with B26 I; inoculation with B26.

