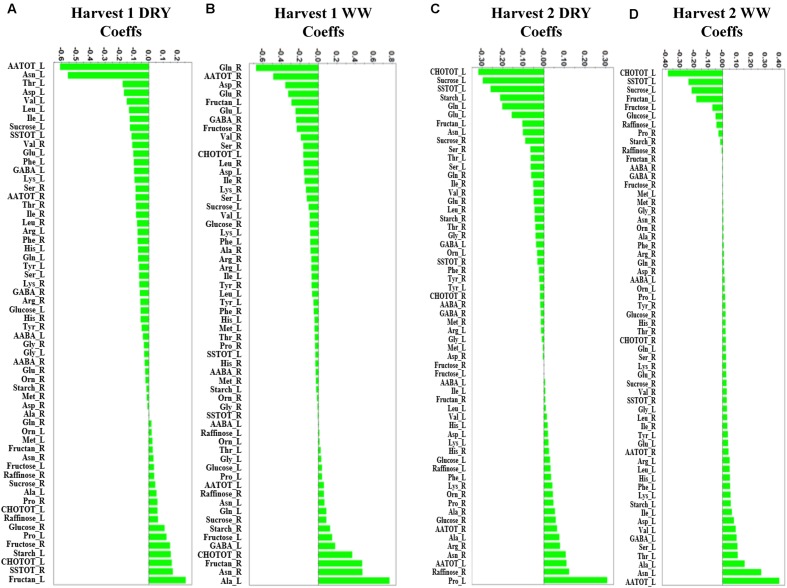
FIGURE 6.
Orthogonal projections to latent structures-discriminant analysis (OPLS-DA) coefficient (Coeffs) plots for the comparisons between inoculated and non-inoculated with B. subtilis B26 timothy plants [shoots (L) and roots (R)] after 4 weeks (Harvest 1) under (A) water stress (DRY) and (B) WW conditions and after 8 weeks (Harvest 2) under (C) water stress (DRY) and (D) WW conditions (P = 0.05). Negative Coeffs values represent metabolites with higher concentrations in inoculated plants whereas positive values correspond to those with higher concentration in non-inoculated plants (Ala, alanine; Arg, arginine; Asn, asparagine; Asp, aspartic acid; Gln, glutamine; Glu, glutamic acid; Gly, glycine; His, histidine; Ile, isoleucine; Leu, leucine; Lys, leucine; Lys, lysine; Met, methionine; Phe, phenylalanine; Pro, proline; Ser, serine; Thr, threonine; Tyr, tyrosine; Val, valine; Orn, Ornithine; AATOT, Total amino acid; SSTOT, total soluble sugars; CHOTOT, total carbohydrates; AABA, α-aminobutyric acid; GABA, γ-aminobutyric acid).

