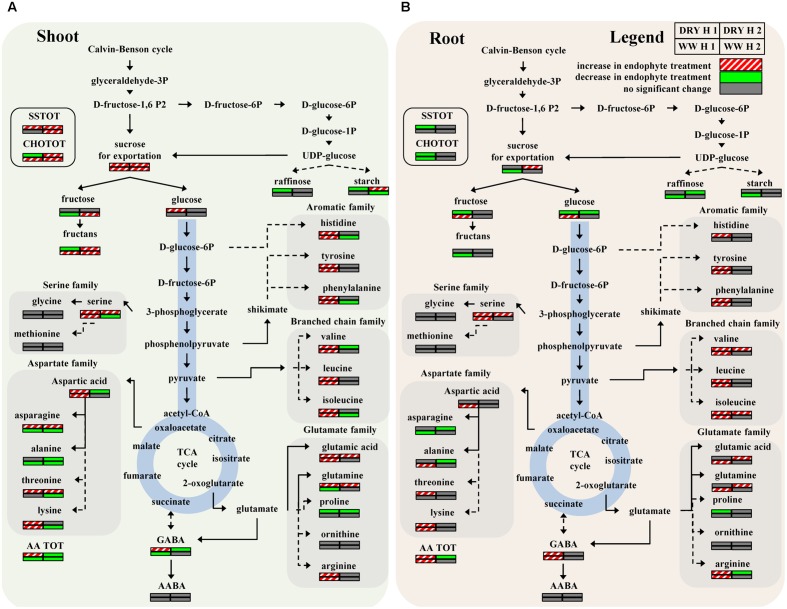
FIGURE 7.
Metabolic pathway maps of changes in metabolite concentration induced by endophyte colonization in timothy shoots (A) and roots (B) after 4 weeks (H1) and 8 weeks (H2) under WW or DRY conditions. Variable relative concentrations (increased, decreased or no change in response to endophytes) are coded using a color based on the means of scaled and centered OPLS regression coefficients from 4 biological replications. Dashed arrows symbolize a multistep and solid arrows a one-step reactions (for abbreviations consult the legend of Figure 6).

