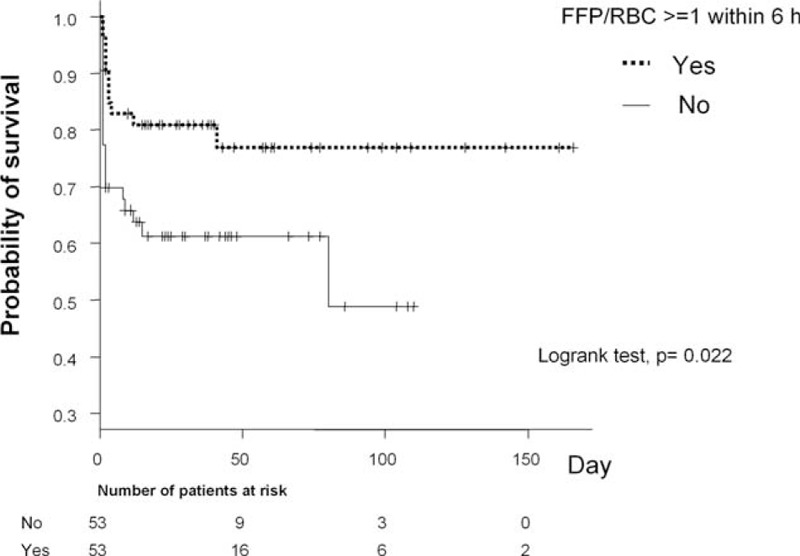
Fig. 1.
Kaplan–Meier curves of patients transfused with an FFP/RBC ratio ≥1 within the first 6 h (red line) and patients transfused with an FFP/RBC ratio <1 within the first 6 h (black line).

Propensity score matching was done between the two groups. The FFP/RBC ratio ≥1 group has a significantly higher survival rate at discharge (log-rank test; P = 0.022).
