
Figure 7.
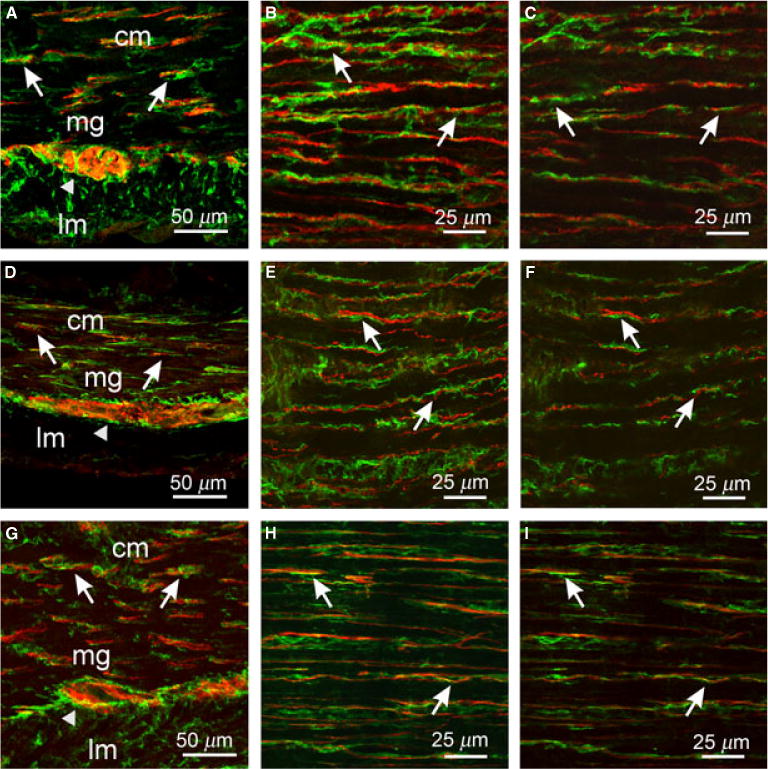
Enteric neurons and PDGFRα+ cells in the small intestine. (A–C) PGP9.5+ neurons and PDGFRα+ cells in cryostat sections (A) and flat mounts (B,C). (D–F) Sub-P+ neurons and PDGFRα+ cells in cryostat sections (D) and flat mounts (E,F). (G–I) nNOS+ neurons and PDGFRα+ cells in sections (G) and flat mounts (H,I). Both classes of enteric neurons (red) were closely apposed to PDGFRα+ cells (green, arrows). Note the even distribution of PDGFRα+ cells and close association with nerve fibers throughout the CM compared to the dense distribution of ICC at the DMP and scant distribution within the CM (see Fig. 4). PDGFRα+ cells also surrounded myenteric ganglia (arrowheads) but did not infiltrate ganglionic sheaths. (C,F,I) Single sections of reconstructed stacks taken from (B,E,H) show both cell types are closely apposed in one optical section. Scale bars are as indicated in each panel.