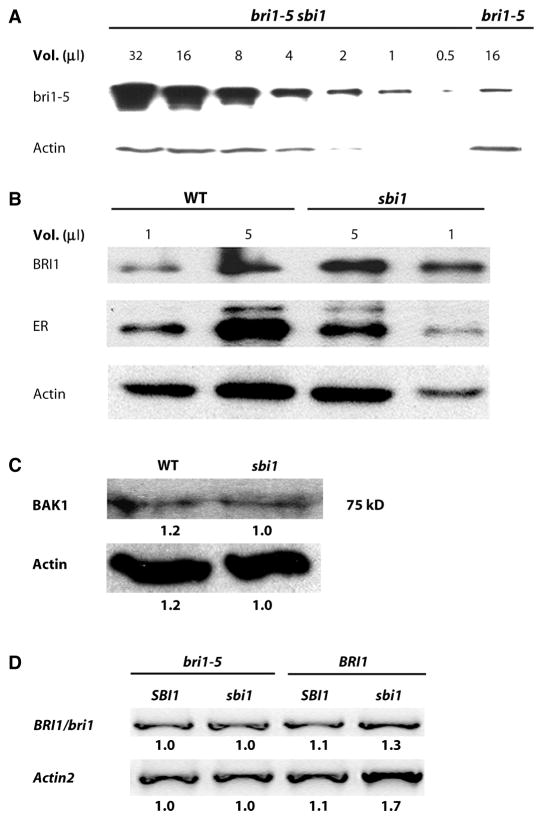
Fig. 2.
The abundance of BRI1 is increased in sbi1 plants. (A) Semi-quantitative Western blot analysis of a series of twofold dilutions from the extract of bri1-5 sbi1 plants reveals that the abundance of bri1-5 was increased compared to that in extracts from bri1-5 plants. Actin served as the loading control. Extracts were prepared from 14-day-old seedlings. Blot shown is representative of three experiments. (B) Protein abundance was detected by Western blotting with specific antibodies against BRI1, the receptor kinase ERECTA (ER), and actin in WT and sbi1 protein extracts. Actin and ER served as controls. WT plants are Ws. Extracts were prepared from 14-day-old seedlings. Blot shown is representative of three experiments. (C) BAK1 was detected by Western blotting with antibodies against the kinase domain of BAK1. Actin served as the loading control. Extracts were prepared from 14-day-old seedlings. The numbers below each band represent the relative band intensities, where the lowest density sample in each row is set to 1. Blot shown is representative of four experiments. (D) WT (Ws), sbi1, bri1-5, and bri1-5 sbi1 plants have similar amounts of bri1-5 mRNAs as shown by RT-PCR. Actin2 was used as an internal control. BRI1/bri1 indicates either the WT or the mutant protein. Relative integrated density is shown below each band, where the lowest-density sample in each row is set to 1. Blot shown is representative of three experiments.

