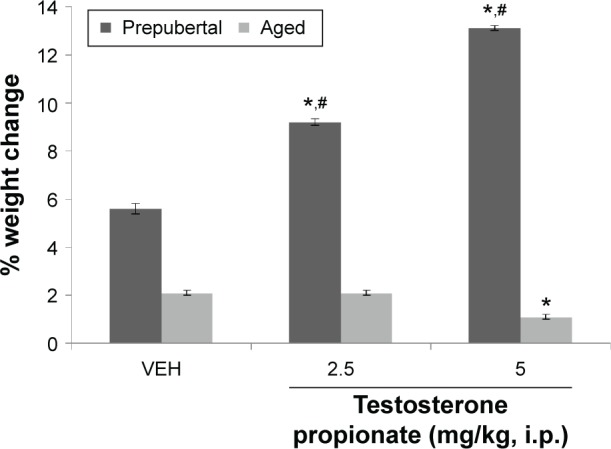
Figure 1.

Effect of TP on body weight.
Notes: Each bar represents mean ± SEM, number of animals per group (n) = 10; *P < 0.05 vs VEH and #P < 0.05 prepubertal vs aged.
Abbreviation: VEH, vehicle.

Effect of TP on body weight.
Notes: Each bar represents mean ± SEM, number of animals per group (n) = 10; *P < 0.05 vs VEH and #P < 0.05 prepubertal vs aged.
Abbreviation: VEH, vehicle.