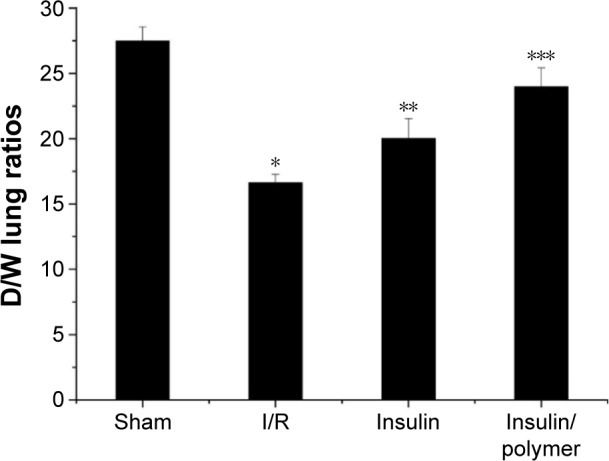
Figure 7.

The level of D/W lung ratios for different groups of rats.
Notes: The pulmonary tissues of Sham, I/R, Insulin, and Insulin/polymer groups rats were collected 24 hours after reperfusion and the levels of D/W lung ratios measured. Results are expressed as mean ± SD. A significant decrease from Sham group is denoted by *P<0.01, a significant increase from I/R groups is denoted by **P<0.01, and a significant increase from I/R groups is denoted by ***P<0.01.
Abbreviations: D/W, dry/wet; I/R, ischemia/reperfusion; SD, standard deviation.
