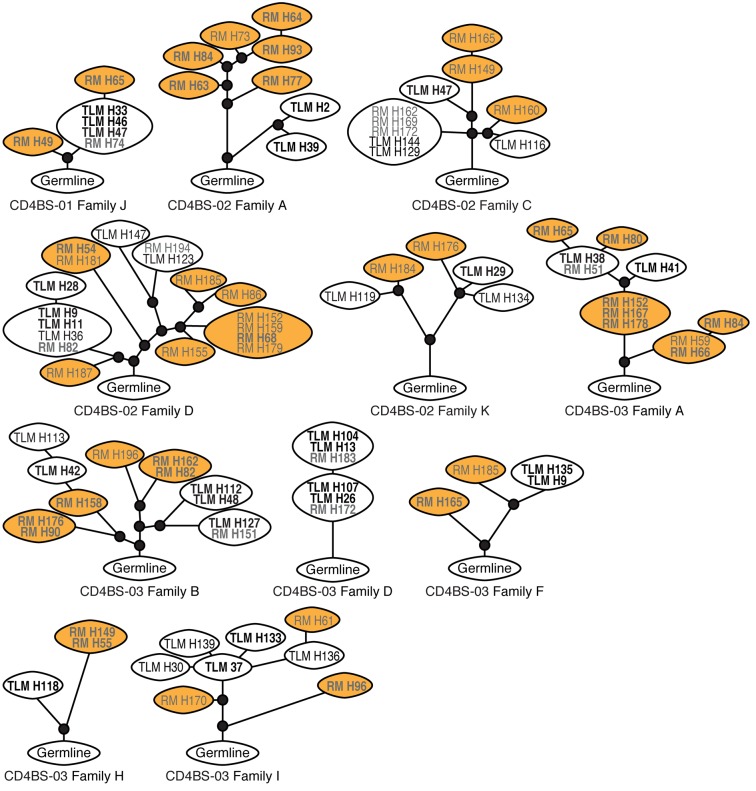
Figure 5. Clonal trees generated from Ig heavy-chain sequences show distinct patterns.
Lineage trees were generated from sequences obtained from RM and TLM B cells from the 3 individuals described in Table 1 and Supplemental Table 1. Expressed mAbs are denoted in bold. Clones within ovals contain identical sequences; white ovals denote TLM-only or mixed clones, and orange ovals denote RM-only clones; small black circles identify inferred intermediates from germline sequence at the base of each tree. Branch lengths reflect SHM frequencies. RM, resting memory; SHM, somatic hypermutation; TLM, tissue-like memory.

