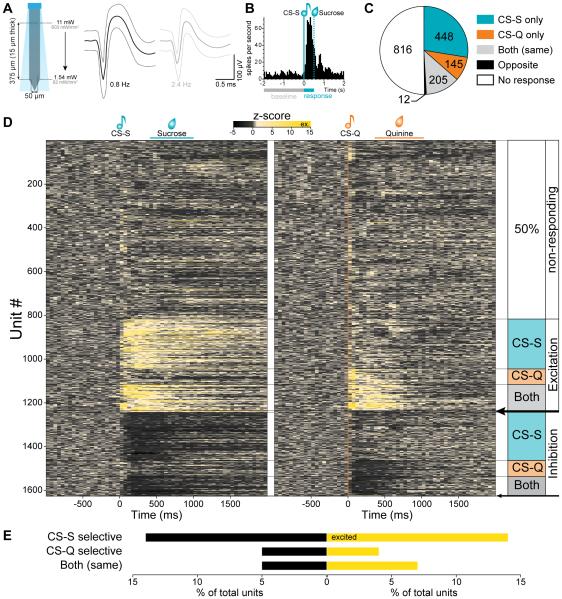
Figure 2. BLA units respond to matched modality sucrose and/or quinine cues.
(A) Schematic of the optrode used to record neural activity. The blue quadrilateral represents the theoretical light cone. Right, the average waveform of 2 units isolated from one recording site (average ±99.7% confidence interval).
(B) Peri-stimulus time histogram (PSTH) of the firing rate of a single unit, to the onset of 30 sucrose predicting cues (CS-S). For each unit, a Wilcoxon signed-rank test determined if the firing rate during the first 500 ms of the cue was significantly different from the 2 s baseline window (p<0.01).
(C) 1626 BLA units were recorded from 21 mice. 810 (50%) had a significantly different firing rates during the first 500 ms of the cue compared to the 2 s before the cue (Wilcoxon signed rank test, p<0.01). 28% responded selectively to the CS-S, 9% to the CS-Q, 13% responded to both cues in the same way and less than 1% responded to both cues in an opposite way.
(D) Heat maps of the z-score of all recorded units in response to the CS-S (vertical teal line, left map) and in response to the CS-Q (vertical orange line, right map). 26% of the units showed a significant excitatory response to one and/or the other auditory cue (Wilcoxon signed-rank test, p<0.01). 14% of the units were selectively excited by the CS-S and 4% by the CS-Q, while 7% were excited by both cues. 24% of the units showed a significant inhibitory response to one and/or the other cue. 14% were selectively inhibited by the CS-S and 5% by the CS-Q while 5% were inhibited by both cues. The black arrows indicate units responding to both cues in an opposite manner (top arrow: excited by the CS-S and inhibited by the CS-Q (0.5%); bottom arrow: inhibited by the CS-S and excited by the CS-Q (0.2%)).
(E) Proportion of units responding to the rewarding cue only (CS-S selective), to the aversive cue only (CS-Q selective) or to both cues in the same way, with an inhibitory response (black) or with an excitatory response (yellow).

