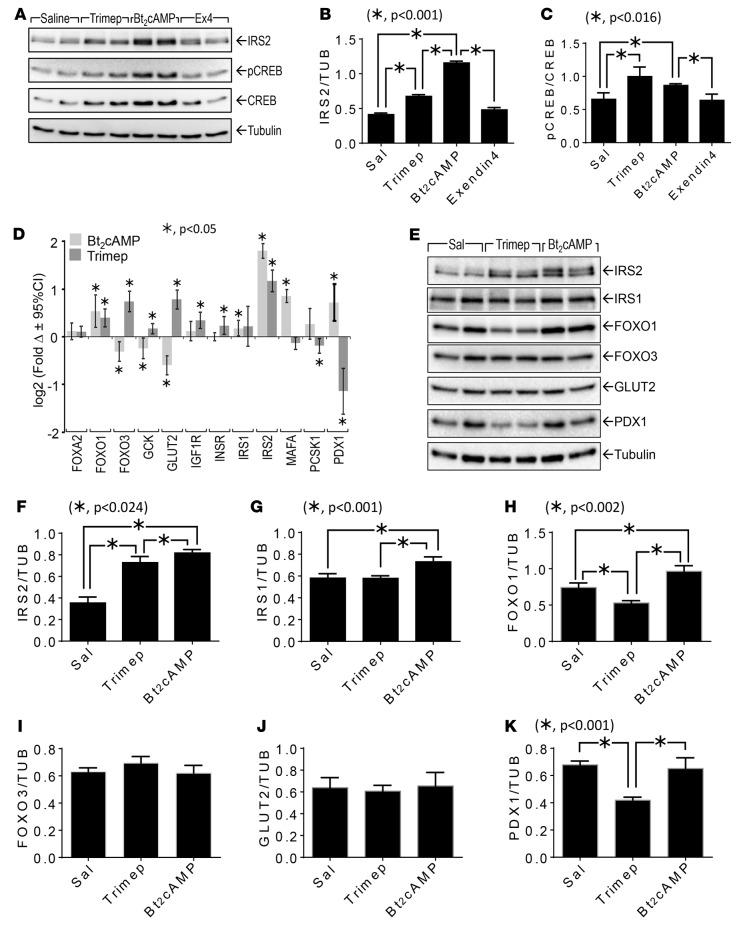
Figure 4. Effect of trimeprazine or Bt2cAMP on gene or protein expression in isolated human islets.
(A–C) Human islets (~100 islets) were treated with or without trimeprazine (20 μg/ml), Bt2cAMP (1 mM), or exendin-4 (250 nM) for 24 hours, and the islet extracts were resolved by immunoblotting. The band intensity for total IRS2 intensity (B) was normalized against tubulin; phosphorylated CREB (pCREB) (C) was normalized against total CREB. The mean ± SEM was determined from 2 data points in 2 experiments; “*” indicates the Bonferroni-corrected P value (in the indicated range, P < 0.05 was significant) determined by a generalized linear model (SPSS, version 23). (D) Human islets (~100 islets) were treated with or without trimeprazine (20 μg/ml) or Bt2cAMP (1 mM) for 5 hours, and expression of the indicated genes was measured with a QuantiGene 2.0 Plex Assay Kit (n = 6). This experiment was repeated with islets from 4 different donors, and the average log2 (fold Δ) ± 95% CI relative to the DMSO control for each gene is shown; “*” indicates the Bonferroni-corrected P value of less than 0.05, determined by GLM using SPSS, version 23. (E–K) Islets (~100 islets) were treated with trimeprazine (20 μg/ml), Bt2cAMP (1 mM), or saline for 24 hours, followed by immunoblot analysis of the indicated proteins in islet extracts. The band intensity of the indicated proteins was normalized against tubulin intensity. The mean ± SEM was determined from 2 data points in 2 experiments; “*” indicates the Bonferroni-corrected P value (in the indicated range, P < 0.05 was significant) determined by GLM (SPSS, version 23). P values greater than 0.05 were omitted from the figure. cAMP, cyclic AMP; Ex4, exendin-4; Sal, saline; Trimep, trimeprazine; TUB, tubulin.

