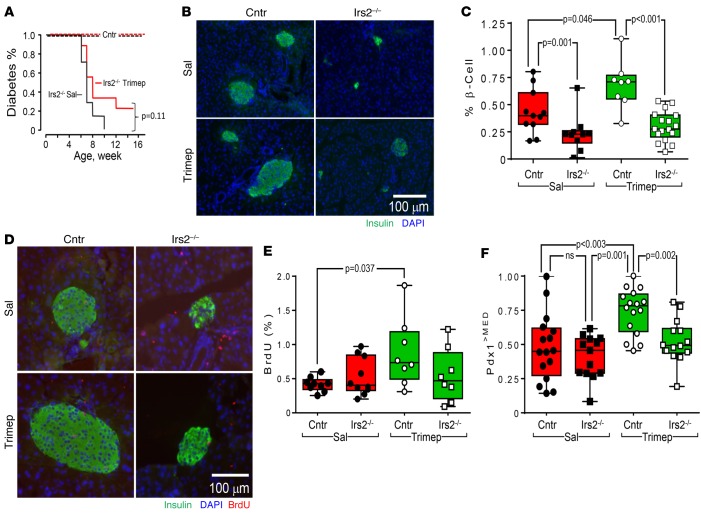
Figure 6. Effect of trimeprazine on β cell function in Irs2–/– mice.
(A) Cox regression analysis of diabetes onset (random blood glucose >200 mg/dl) in 15 Irs2–/– or control male mice treated without (saline, black line) or with 10 mg/kg trimeprazine (red line) once a day starting at 5 weeks of age until diabetes was diagnosed or the mice reached 16 weeks of age. (B) Control (n = 8) or Irs2–/– (n = 8) mice were treated for 3 weeks with or without 10 mg/kg trimeprazine, and pancreas sections were immunostained with Abs against insulin or stained with DAPI. (C) Two pancreatic sections were analyzed for each mouse, and at least 4 mice were analyzed in each experimental group to determine the percentage of β cell area. The horizontal black bar in the box shows the median, and a GLM (IBM SPSS, version 23) was used to obtain Bonferroni-corrected P values, with genotype and treatment as interacting factors. (D) BrdU incorporation in pancreas sections from 9-week-old control or Irs2–/– mice treated between 6 and 9 weeks of age with or without daily trimeprazine (10 mg/kg). (E) Two pancreatic sections (10 × 10 tiles) were analyzed for each mouse, and at least 4 mice were analyzed for each group to determine the percentage of BrdU-positive β cells against the total number of insulin-positive β cells. The black horizontal bar in the box shows the median, and a GLM was used to obtain the Bonferroni-corrected P values, with genotype and treatment as interacting factors. (F) Control or Irs2–/– mice were treated for 3 weeks with or without trimeprazine. Multiple pancreas sections from 2 or 3 mice in each experimental group were used to calculate Pdx1>MED (see Supplemental Table 2 and the Methods). Box plots show the distribution of Pdx1>MED, and a GLM was used to obtain the Bonferroni-corrected P values, with genotype and treatment as interacting factors. Cntr, control; Sal, saline; Trimep, trimeprazine.

