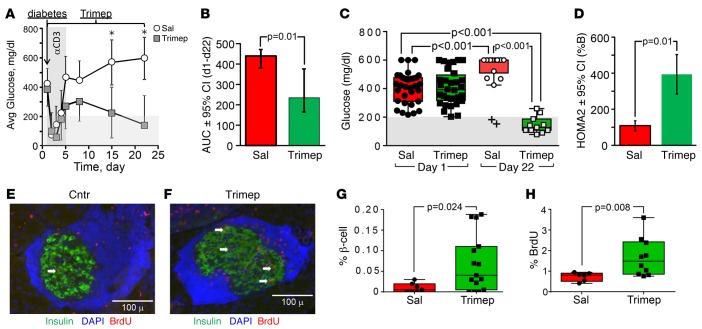
Figure 7. Metabolic and islet parameters from untreated or trimeprazine-treated diabetic NOD mice.
(A) Random blood glucose levels (avg ± SD, *P < 0.01) in NOD mice from the day diabetes (blood glucose >200 for 2 consecutive days) was detected. Diabetic mice were treated with αCD3 once a day for 5 days, with or without trimeprazine (10 mg/kg) once a day for 22 days. Each treatment group consisted of 16 mice on day 0. (B) AUC calculated from the graph in A. (C) Random blood glucose levels on the first and second days that diabetes was detected (black squares and circles) before initiating treatment with (open squares on green background) or without (open circles on red background) trimeprazine. Box plots show the distribution, and the black horizontal line shows the median. “+” indicates outliers. A GLM (SPSS, version 23) was used to obtain the Bonferroni-corrected P values. (D) HOMA2%B was calculated to estimate β cell function. The GLM was used to determine the mean value and obtain the Bonferroni-corrected P values, with treatment as the factor. (E and F) Pancreas sections from 9 untreated and 15 trimeprazine-treated NOD mice (6 untreated mice of the 15 total were unavailable at 22 days because they were sacrificed when they developed fatal hyperglycemia before the end of the experiment). Dense blue staining around the islets shows lymphocyte nuclei (insulitis). Arrows show BrdU/insulin double-positive cells. The percentage of β cell area (G) or the percentage of BrdU (H) calculated from the total number of insulin-positive β cells was determined using IMARIS software. Box plots show the distribution, and the black horizontal bar shows the median. Comparisons were made by GLM, with treatment as the only factor. Avg, average; Sal, saline; Trimep, trimeprazine.

