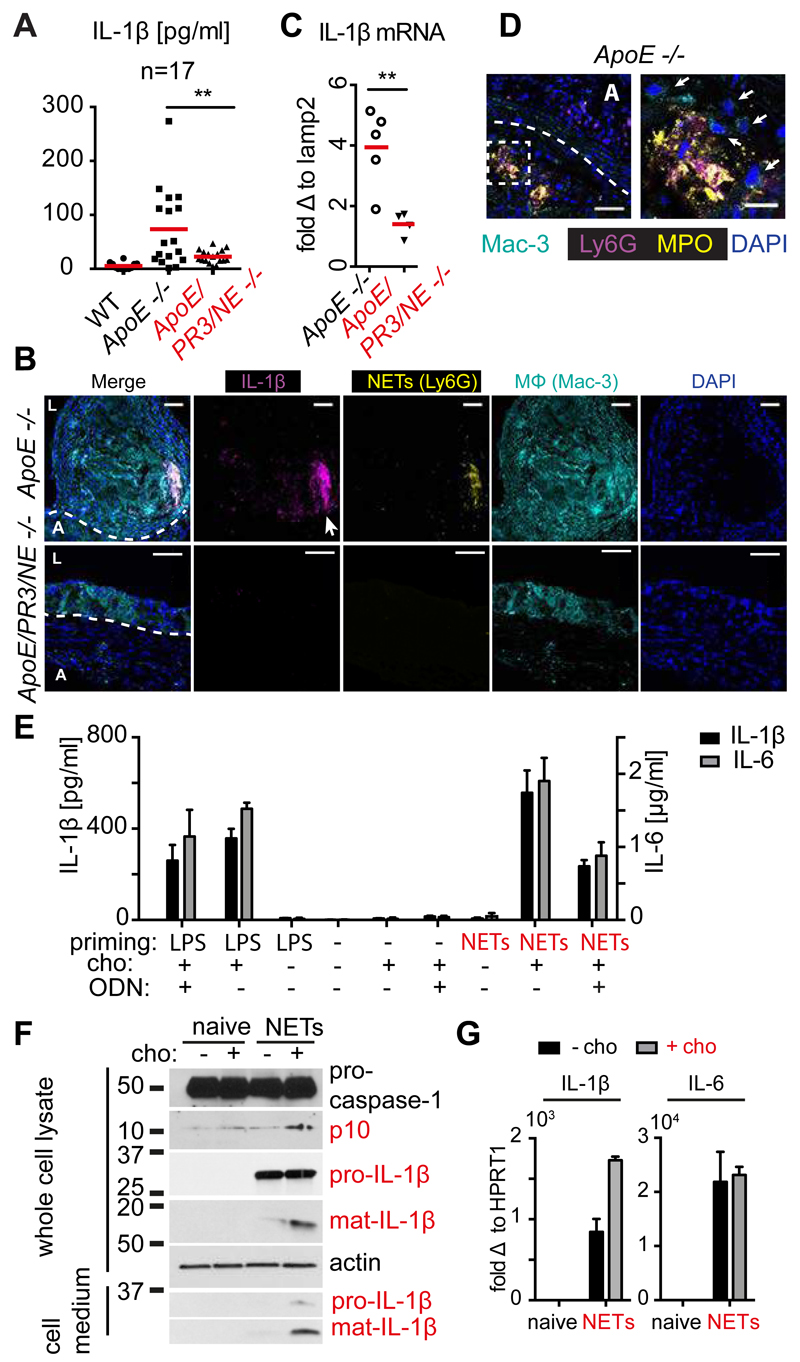
Figure 3. NETs prime macrophages for cytokine release.
(A) Plasma levels of IL-1β from WT, ApoE -/- and ApoE/NE/PR3/ -/- on HFD for 8 weeks, measured by ELISA in n=17 mice per strain pooled from three independent experiments. (B) Representative confocal immunofluorescence microscopy images of aortic root sections from 8 ApoE -/- and 5 ApoE/NE/PR3 -/- mice in 2 independent experiments placed on HFD for 8 weeks and stained with the macrophage marker Mac-3 (cyan), IL-1β (magenta), the neutrophil marker Ly6G (yellow) and DNA (DAPI, blue). Dotted line denotes the adventitia (A) / lesion boundary and (L) the lumen. Scale bars: 50 μm (C) Representative IL-1β mRNA levels in aorta of 5 ApoE -/- and 4 ApoE/NE/PR3/ -/- mice repeated in 2 independent experiments where fed on HFD for 8 weeks measured by qPCR. mRNA levels were normalized to the monocyte/macrophage specific gene lamp2 and expressed relative to levels measured in WT mice. A power analysis measured 89% power for the difference of means between ApoE -/- and ApoE/PR3/NE -/- mice. (D) Representative confocal immunofluorescence microscopy images of aortic root sections from 5 ApoE -/- mice placed on HFD for 8 weeks and stained with the macrophage marker Mac-3 (cyan), MPO (magenta), citrullinated histone 3 (Cit-H3, yellow) and DNA (DAPI, blue). Scale bars: 50 μm. Right panel is a close-up of the highlighted area of the left panel and arrows point to macrophages. Scale bars: 20 μm. (E) Mature IL-1β (black bars, left y axis) or IL-6 (grey bars, right y-axis) protein released by CD-14 blood-derived human monocytes untreated or treated with LPS or NETs alone or in the presence of cholesterol crystals. Where indicated, cells were treated with 10µg/ml oligonucleotide inhibitor (ODN).(F) Whole cell lysates or cell culture medium from naïve CD-14 blood-derived human monocytes or treated with NETs alone (black bars) or in the presence of cholesterol crystals (grey bars) analyzed by SDS-PAGE electrophoresis and immunoblotted for IL-1β, caspase-1 and actin. (G) IL-1β (left panel) or IL-6 (right panel) mRNA in naïve CD-14 blood-derived human monocytes or treated with NETs alone (black bars) or in the presence of cholesterol crystals (grey bars). (E-G) Representative data of 3 independent experiments with standard error across 3 technical replicates. Statistics by Student’s t-test for single comparison and two-way ANOVA, followed by Sidak’s multiple comparison post test for multiple comparisons: * p<0.05, ** p<0.01, *** p<0.001, **** p<0.0001.

