
Figure 1.
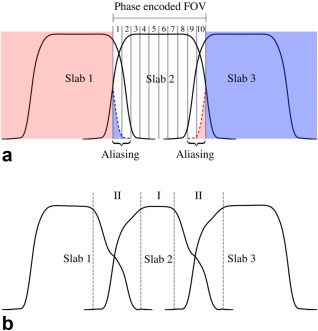
(a) Illustration of slab aliasing. The multislab acquisition shown here excites three slabs with 10 phase‐encodes for each slab. Extension of the slab profile is wider than the phase encoded FOV (also the predefined slab thickness), leading to aliasing artifacts. (b) Illustration of slab crosstalk effect. The slab profile extends to its adjacent slabs, exacerbating T1 saturation effects at slab boundaries where adjacent slabs overlap. In this example with three‐slab acquisition, magnetization at the slab center (region I) is excited every TR, whereas magnetization at slab boundary (region II) is excited with intervals of 2/3TR, 1/3TR, 2/3TR, 1/3TR…, leading to decreased signal at slab boundaries and asymmetry in the shapes. Slab profiles were generated using Bloch simulation with TR = 20 s (a) and 2 s (b), respectively, and interleaved acquisition order. Details of other simulation parameters are described in the Methods section.