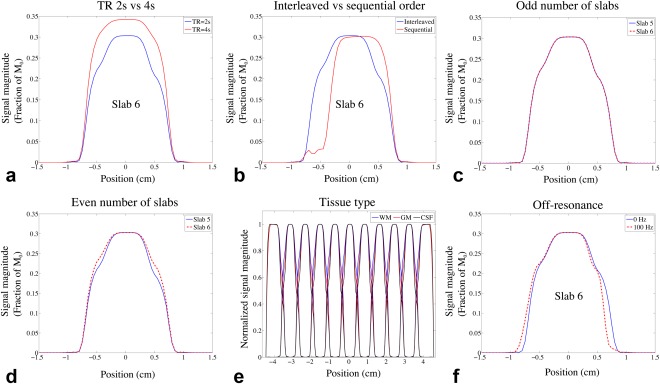
Figure 2.

Results of Bloch simulation. (a–d) Comparison of signal profiles of WM generated from Bloch simulation using different TRs, acquisition schemes, and number of slabs. (a) 11 slabs, interleaved acquisition with TR = 2 s (blue) and TR = 4 s (red). (b) TR = 2 s, 11 slabs with interleaved acquisition (blue) and sequential acquisition (red). (c) TR = 2 s, interleaved acquisition with 11 slabs; the signal profiles of slab 5 (blue) and slab 6 (red) are overlaid for better comparison. (d) TR = 2 s, interleaved acquisition with 12 slabs; the signal profiles of slab 5 (blue) and slab 6 (red) are overlaid. The effects of TR, acquisition scheme, and number of slabs on GM and CSF are similar to WM and are not shown here. (e) Slab profiles for WM, GM, and CSF, which were generated by normalizing the MR signal profile with the signal magnitude of the center slice. (f) Centered signal profiles simulated with 0 Hz and 100 Hz off‐resonance frequencies.
