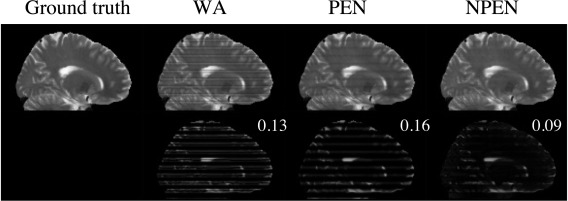
Figure 6.

Reconstruction results from simulated data. Upper row: ground truth image and images reconstructed by WA, PEN, and NPEN. Lower row: difference maps between the reconstructed images and the ground truth; RMSE is shown in the upper right‐hand corner. The difference map is rescaled for better depiction of the error distributions.
