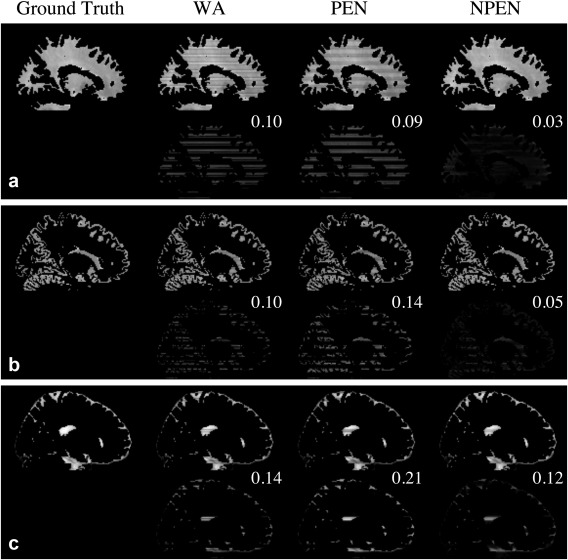
Figure 7.

Tissue‐specific comparison of the reconstruction results from simulation data for (a) WM, (b) GM, and (c) CSF. For each tissue type, the upper row shows the reconstruction results, whereas the lower row shows the difference maps between the reconstructed images and the ground truth. RMSE is shown in the upper right‐hand corner of the difference map. The difference map is rescaled for better depiction of the error distributions.
