
Figure 6.
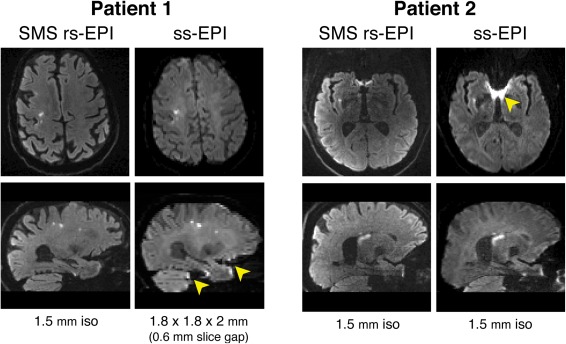
Comparison of SMS rs‐EPI and ss‐EPI and in two lacunar stroke patients. Regions in ss‐EPI images where distortion and signal pile‐up is worse than SMS rs‐EPI (indicated by yellow arrows) appear similar to stroke lesions.
Official websites use .gov
A
.gov website belongs to an official
government organization in the United States.
Secure .gov websites use HTTPS
A lock (
) or https:// means you've safely
connected to the .gov website. Share sensitive
information only on official, secure websites.
Comparison of SMS rs‐EPI and ss‐EPI and in two lacunar stroke patients. Regions in ss‐EPI images where distortion and signal pile‐up is worse than SMS rs‐EPI (indicated by yellow arrows) appear similar to stroke lesions.