
Figure 8.
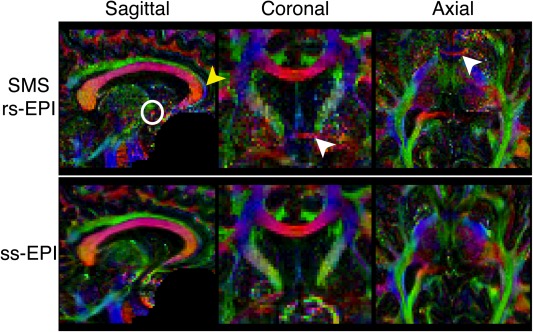
7T DTI results comparing blurring and distortion in the 1.2 mm isotropic ss‐ and rs‐EPI acquisitions. The rs‐EPI data show the anterior commissure (white circle and arrows), which is not present in the ss‐EPI data. rs‐EPI also exhibits reduced blurring and distortion in the cingulum (yellow arrow). Color‐coded maps of the principal eigenvector are shown. Color code: green, anterior–posterior; blue, superior–inferior; red, left–right.