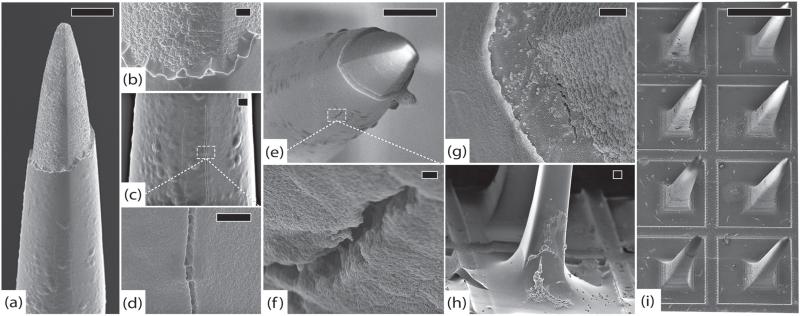
Figure 7.
SCT-RVI, 99 days. (a) Representative electrode tip, scale 20 μm. (b) Detail of electrode from (a) showing intact platinum and no delamination at the parylene interface, scale 2 μm. (c) Closer view of electrode from (a) showing longitudinal cracks in the parylene, scale 2 μm. (d) Detail of parylene crack, scale 2 μm. (e) Another typical electrode with intact platinum and minimal encapsulation, scale 20 μm. (f) Detail of cracked parylene, scale 300 nm. (g) Closer view of parylene interface showing early delamination and a thin veil of encapsulation tissue, scale 1 μm. (h) Base of an electrode with fibroblasts along the shaft. There is a distinct layer of encapsulation tissue creeping up the electrode, scale 20 μm. (i) Globular macrophages and spindle-shaped fibroblasts are visible on the base of the array, scale 300 μm. All images in this figure were taken at 5 kV.

