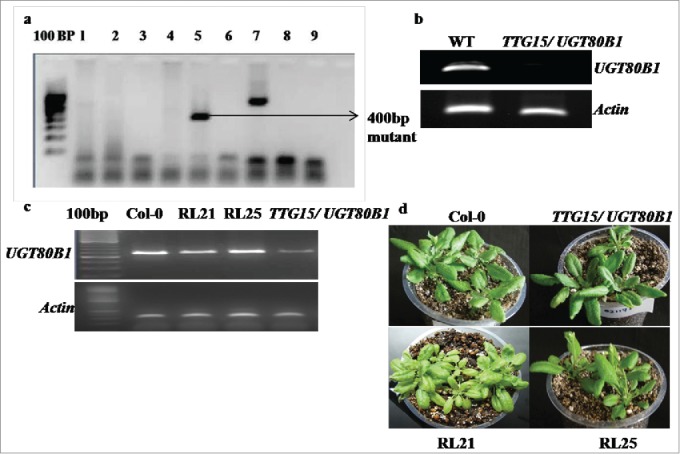
Figure 1.

PCR analysis of homozygous lines. Lines carrying T-DNA mutations with kanamycin selection (A). RT-PCR analysis of homozygous lines of Salk-021175 mutants (B). Gene expression analysis in Col-0, TTG15/ UGT80B1 mutants and p35:TTG15/UGT80B1 restored lines (C) Restored plant RL21 and RL25 (D).
