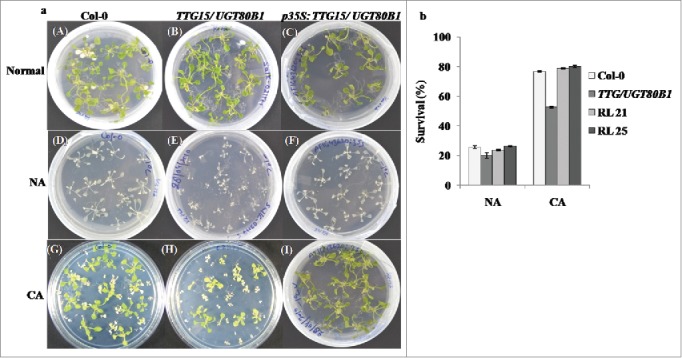
Figure 3.

Freeze stress analysis of the plants. Stress analysis of the normal, CA and NA condition of Col-0, TTG15/UGT80B1 mutant and p35S:TTG15/UGT80B1 restored lines i.e., RL21 and RL25 (A). Survival percentage of the plants after cold stress (B) in Col-0, TTG15/ UGT80B1 mutant and RL21, RL25 restored lines.
