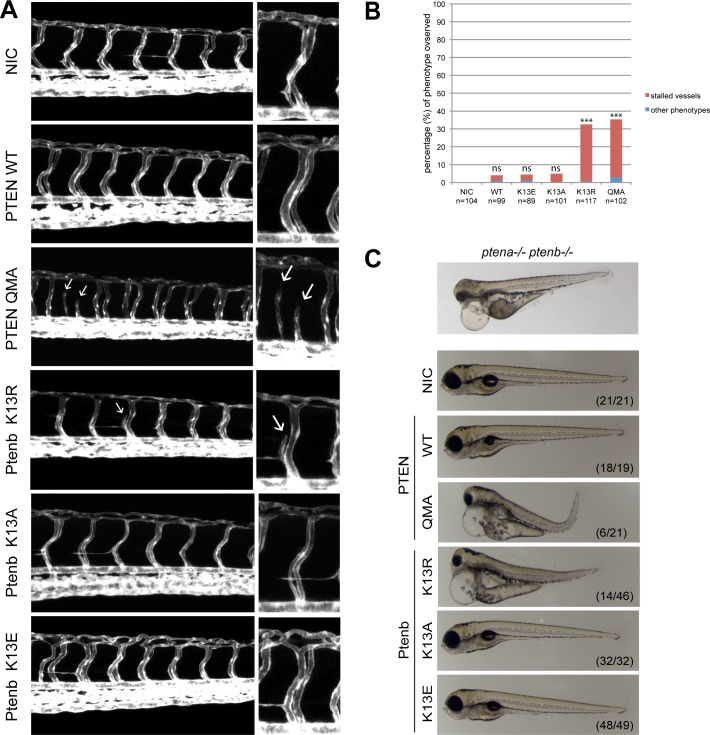
Fig 5. Ptenb K13R and PTEN QMA induce stalled vessels and developmental defects in wild type embryos.
(A) Tg(kdrl:eGFP) zebrafish embryos were microinjected at the one-cell stage with 300 pg synthetic mRNA encoding either PTEN-mCherrry WT, PTEN-mCherry QMA, Ptenb-mcherry K13R, Ptenb-mCherry K13A or Ptenb-mCherry K13E. At 3dpf the embryos were analyzed for the hyperbranching or stalled vessel phenotype by confocal live- imaging using a Leica TCS-SPE microscope (anterior to the left, 20x objective, 2μm z-stacks). Pictures show the trunk region distal to the urogenital opening of representative embryos; non-injected control embryos (NIC) were included for reference. Stalled vessels are indicated with white arrows. (B) Quantification of the number of embryos showing either stalled intersegmental vessels (red bars) or other phenotypes, such as hyperbranching (blue bars) (percentage of total number of embryos). The statistical significance was determined using two-tailed Fisher’s Exact test. (ns = not significant, * = p-value < 0.05, ** = p-value < 0.01, *** = p-value < 0.001). (C) At 4dpf, brightfield images of single embryos were taken to assess gross morphological defects in response to expression of PTEN, Ptenb or mutants. A picture of a mutant ptena-/-ptenb-/- embryo (top panel) is provided as a reference. Note the massive edemas, short body axis and craniofacial abnormalities in the ptena-/-ptenb-/- embryo as well as the embryos expressing PTEN QMA and Ptenb K13R. The numbers in the bottom right corner represent the number of embryos showing the depicted phenotype/ total number of embryos.

