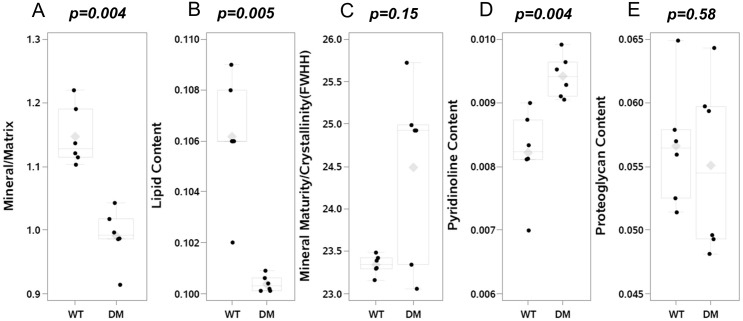
Fig 3. Matrix Properties by Raman Spectroscopy in femoral bones.
Raman microspectroscopic measurement showed a decrease in mineral/matrix ratio [v2PO4/Amide III] (panel A) and in relative lipids content [lipids/Amide III] (panel B) in diabetic OVE26 mice (n = 6) as compared to wildtype FVB mice (n = 6). Mineral maturity/crystallinity [FWHH V1PO4] did not differ (panel C) in diabetic OVE26 mice. In contrast, relative pyridinoline content was increased in diabetic OVE26 mice (panel D), while there was no difference in relative proteoglycan content [PG/ Amide III] (panel E). The mean value is indicated by the grey diamond; the median by the horizontal line; the 25% and 75% by the boxes and the 95% confidence interval by the bars.

