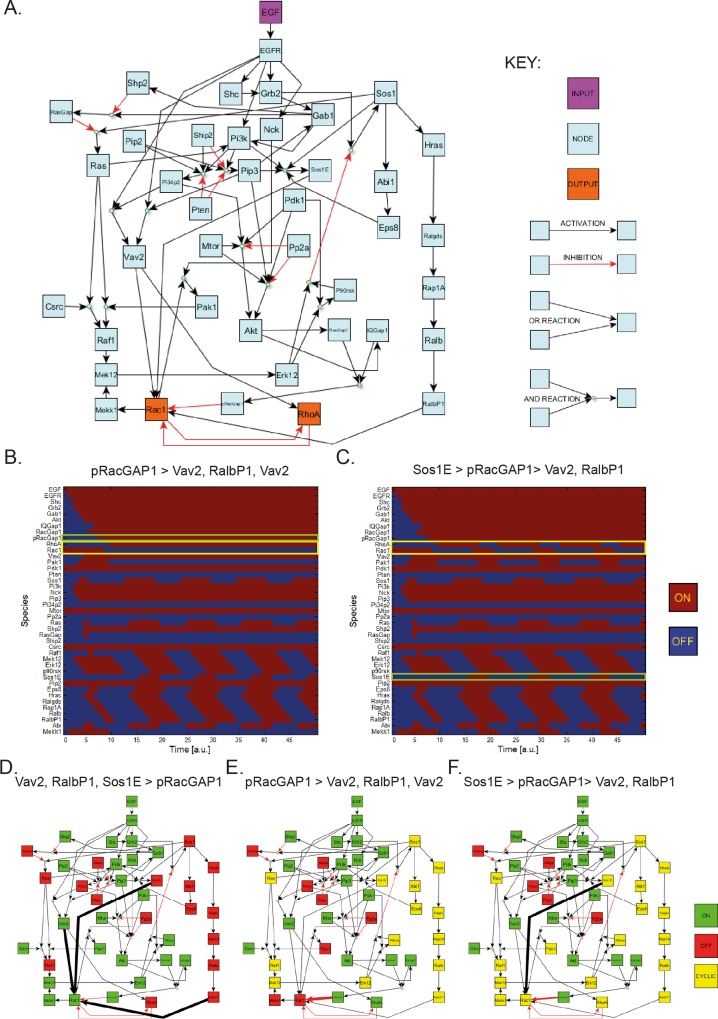
Fig 1. Logical simulation of integrin-driven cell migration.
A. Reconstructed network describing signalling events leading to GTPase activity. The model consists of one input node, EGF, two nominated output nodes, Rac1 and RhoA, and 38 intermediate nodes. Reactions included in the model are activation or inhibition, where some reactions need cooperation of two or more upstream nodes via AND gates. See S1 Table for references to all reactions included in the model. B, C. Time-course simulation outputs for the first 50 time increments of the model for different Rac1 activator/inhibitor hierarchies, where the outputs of interest Rac1 and RhoA (yellow box) and the dominant Rac1 activator/inhibitor (green box) are highlighted: B. pRacGAP1 dominates Rac1 activity above all Rac1 activator. As pRacGAP1 activity is ‘switched’ ON, Rac1 activity is ‘switched’ OFF after one time increment, RhoA activity is ‘switched’ ON a further time increment later and Rac1/RhoA remain OFF/ON respectively as t → ∞; C. Sos1E dominates Rac1 activity over pRacGAP1 which in turn dominates Rac1 activity over Vav2 and RalbP1. Initially pRacGAP1 activation switches OFF Rac1 which switches on RhoA later as before, however when Sos1E is ‘switched’ ON (green box), Rac1 is ‘switched’ ON after one time increment and then RhoA is ‘switched’ OFF after one further time increment. When Sos1E is later ‘switched’ OFF, Rac1 and subsequently RhoA are switched OFF/ON respectively, leading to cyclic activity of Rac1 nd RhoA as t → ∞. D-F. Steady-state outputs of the model for simulations with example different Rac1 activator/inhibitor hierarchies (full list of hierarchies in S3 Table), where activator/inhibitor dominance is visualised by reaction arrow thickness: D. All Rac1 activators Vav2, RalbP1 and Sos1E (Sos1-Eps8-Abi1 complex) (thick black arrows) dominate Rac1 activity over the Rac1 inhibitor pRacGAP1 (thin red arrow); E. pRacGAP1 (thick red arrow) dominates Rac1 activity over Vav2, RalbP1 and Sos1E (thin black arrows); F. Sos1E (thick black arrow) dominates Rac1 activity over pRacGAP1 (medium red arrow) which in turn dominates Rac1 activity over Vav2 and RalbP1 (thin black arrows). Note steady-state outputs in the Boolean simulations can only be stable activity where the node is ON for all time as t → ∞ (green), stable inactivity where the node is OFF for all time as t → ∞ (red) and cyclic activity where the node is encapsulated in a stable limit cycle and cycles regularly between ON and OFF activity as t → ∞ (yellow). All simulations performed in CellNetAnalyzer.

