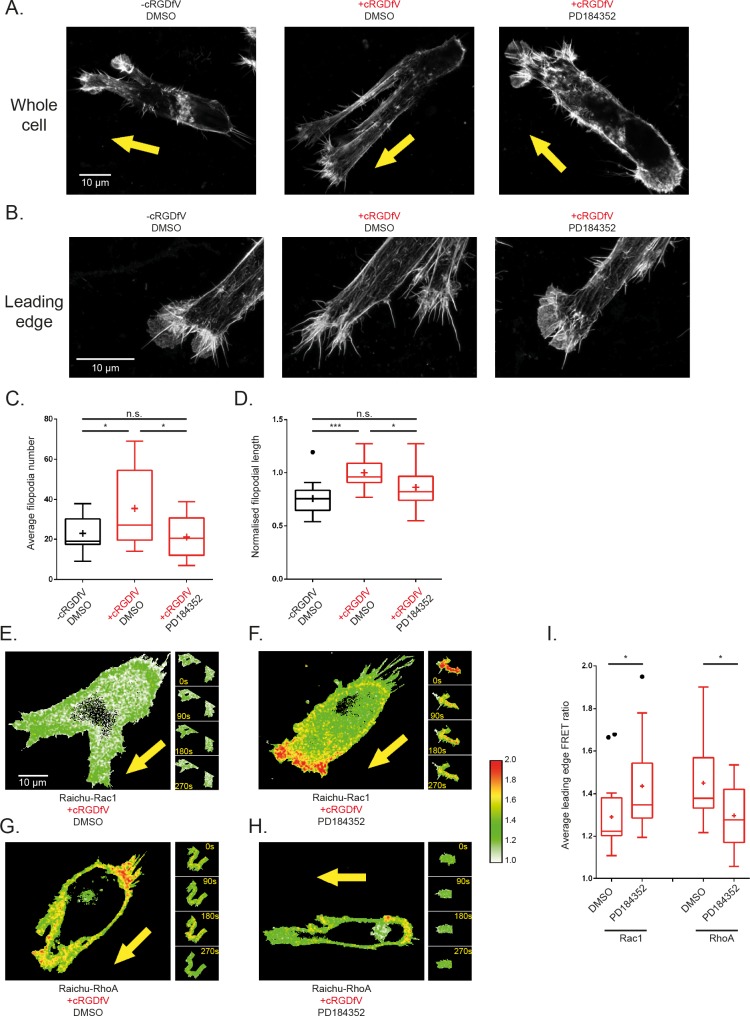
Fig 3. MEK1/2 inhibition promotes invasive-opposing leading edge lamellipodial structures in 3-D by increasing localised Rac1 activity and decreasing localised RhoA activity.
A Whole A2780 cells seeded on cell derived matrix and stained with Alexa Fluor 488 Phalloidin, imaged by confocal microscopy to reveal actin structures of cells arrested in position during migration subject to different treatment conditions: (left) a cell without cRGDfV stimulation and treated with DMSO ~2 hours prior to fixing exhibiting a more 3-D lamellipodial actin structure; (centre) a cell treated with cRGDfV and DMSO for vehicle ~2 hours prior to fixing exhibiting more pseudopodia and filopodia at the leading edge; (right) a cell treated with cRGDfV and PD184352 ~2 hours prior to imaging exhibiting a reversion back to a more lamellipodial leading edge. B. High resolution maximum Z projection images of the leading edge actin structures of cells fixed and stained as in A. A 0.7 Airy pinhole was used to delineate individual filopodia, with a zoom factor of 4.0 on a 100x objective for cells treated: (left) without cRGDfV, with DMSO which exhibits fewer, shorter filopodial protrusions and abundant actin veiling; (centre) with cRGDfV and DMSO for vehicle, which exhibits more, longer filopodia and little actin veiling; (right) with cRGDfV and PD184352 which exhibits a reversion to the basal phenotype with fewer, shorter filopodia with increased actin veiling. C-D. Average C. number and D. normalised length of filopodia per leading edge of fixed, polarised cells in maximum projection high resolution confocal Z-stack images under treatment conditions as indicated. N > 13 cells per condition across 3 experimental repeats, one way ANOVA with Holm-Sidak post hoc test, * indicates p<0.05, *** p<0.001. E-H Representative Ratiometric FRET images of whole A2780 cells on CDMs at single timepoints (main images) and leading edge quantified areas (panel of images, right). E. Cell transfected with Raichu-Rac1 probe, stimulated with cRGDfV and treated with DMSO for vehicle; F. Cell transfected with Raichu-Rac1 probe, stimulated with cRGDfV and treated with PD184352; G. Cell transfected with Raichu-RhoA probe, stimulated with cRGDfV and treated with DMSO for vehicle; H. Cell transfected with Raichu-RhoA probe, stimulated with cRGDfV and treated with PD184352. All images have the same custom look-up table (LUT) applied and set between 1.0 and 2.0 (shown, right of images), where red pixels denote high GTPase activity. I. Quantification of average FRET ratio in the leading edge of all analysed cells across all 20 timepoints in each 5 minute movie. N > 15 cells across 3 experimental repeats. Tukey boxplot used with mean indicated as +. Student t-tests used, * indicates p <0.05.

