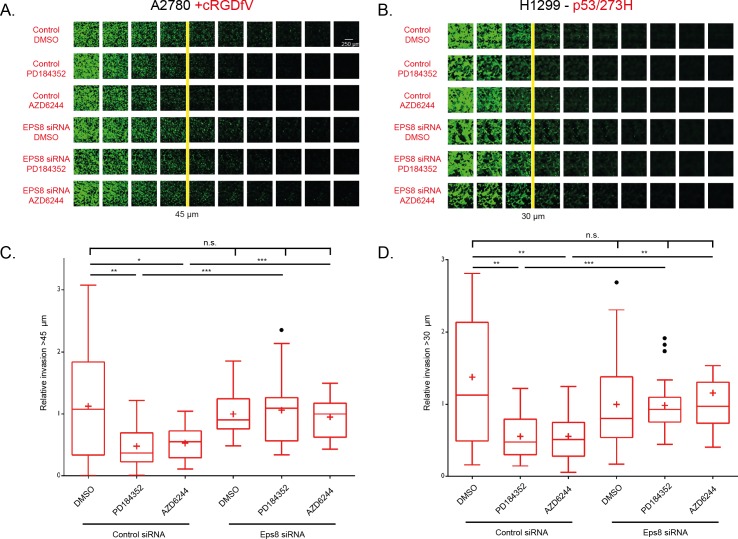
Fig 5. MEK1/2 inhibition significantly reduces α5β1/RCP driven 3-D invasion, Eps8 reverses the ME1/2 inhibition effect.
A-B. Images of cells stained with calcein-AM following 48 hours of invasion into a fibronectin supplemented collagen matrix. Images shown are individual Z positions 14.97 μm apart, with the direction of invasion left to right for the images (the far left image for each condition is the bottom of the transwell). Cells were transfected with control siRNA or Eps8 siRNA 24 hours prior to seeding onto inverted transwells. MEK1/2 inhibitors or DMSO were used 24 hours after invasion was initiated to allow for proliferation. A. A2780 cells stimulated with cRGDfV throughout invasion assay with control/Eps8 siRNA and DMSO/PD184352 as indicated. 45 μm line has been taken as threshold for invasion, beyond which cells are thought of as invasive. B. As in A for H1299 cells stably expressing mutant p53. H1299 cells are less invasive so the 30 μm line has been taken as threshold for invasion. C-D. Quantification of at least 3-independent invasion assay experiments. Invasive proportion is calculated as the total GFP fluorescence for all the images above the invasive threshold (45 μm for A2780s, 30 μm for H1299s) divided by the total GFP fluorescence in all images. All data has been normalised to the Eps8 siRNA, DMSO treated condition to give relative invasion levels for all conditions for: C. A2780 cells stimulated with cRGDfV; D. H1299s cells stably expressing mutant p53. Graphs are Tukey boxplots with mean represented as +, individual student t-tests used as indicated, * indicates p <0.05, ** indicates p <0.01, *** indicates p < 0.001.

