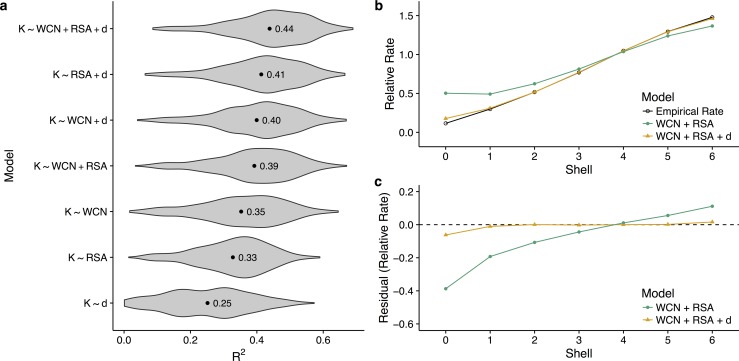
Fig 2. Relative performance of functional and structural predictors of rate.
(a) Distribution of R2 values for various linear models explaining rate, fitted individually for each enzyme. Labeled points within each distribution indicate the mean R2 value across enzymes. For each enzyme, we regress site-specific evolutionary rate (K) against some combination of the distance to the nearest catalytic residue (d), weighted contact number (WCN), and relative solvent accessibility (RSA). On average, the addition of distance to the structural constraints WCN and RSA increases the percent variance explained by the linear models by at least 5 percentage points. (b) Mean empirical and predicted rates, separated by shell. A model containing only WCN and RSA overestimates rates near the active site of the enzyme, and the addition of distance corrects this behavior. (c) Mean residuals for linear models with and without distance as a parameter, separated by shell. Without distance, WCN and RSA cannot accurately predict rates within shells 0–4, or equivalently within a distance of 17.5 Å from a catalytic residue. See S3 Fig for plots of relative rate and residuals versus shell for additional models. Data underlying this figure are available on Github: https://github.com/benjaminjack/enzyme_distance/tree/master/figure_data.

