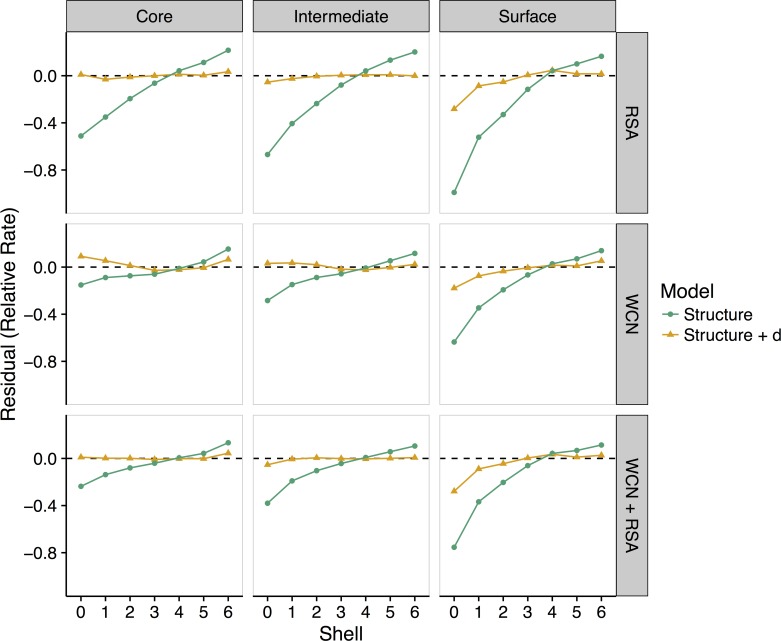
Fig 4. Effect of active-site location on the relationship between site-specific evolutionary rates and distance to the nearest catalytic residue.
Enzymes are grouped into three categories, based on the mean solvent exposure of their catalytic residues: core (RSA < 0.05), intermediate (0.05 < RSA < 0.25), and surface (RSA > 0.25). Lines represent mean residuals for different structural linear models (vertical labels, right) and those same models with distance added as a variable. As the active site location moves from the core to the surface of an enzyme, structural constraints (WCN, RSA, and WCN + RSA) increasingly overestimate rates within shells 3–4. Models including distance as a variable predict rates more accurately in shells 0–6, even when the active site is located on the surface. See S4 Fig for plots of residuals versus shell for an additional model, K ~ d. Data underlying this figure are available on Github: https://github.com/benjaminjack/enzyme_distance/tree/master/figure_data.

