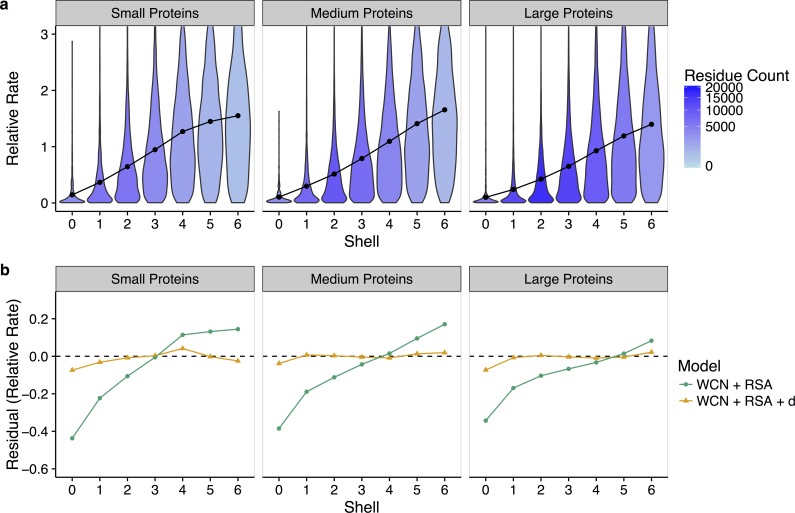
Fig 5. Effect of protein size on the relationship between site-specific evolutionary rates and distance to the nearest catalytic residue.
(a) Distribution of rates within each shell, where proteins have been separated into small (95–368 sites), medium (270–385 sites), and large (386–1,287 sites) based on amino-acid sequence length. Points represent the mean rate in each shell. Shading denotes the quantity of residues in each shell. As the size of the protein increases, the distance–rate slope decreases and distance effects extend further from the active site. (b) Mean residuals in each shell for models with and without distance, again separated by protein size. The addition of distance to a structural-constraints (RSA and WCN) model increases the accuracy of rate prediction near the active site up to shell 3 (17.5 Å) in small proteins and up to shell 5 (27.5 Å) in large proteins. Thus, the constraining effects of catalytic residues depend on protein size, with stronger, more local effects in small proteins, and weaker, longer-range effects in large proteins. See S5 Fig for plots of residuals versus shell for an additional model, K ~ d. Data underlying this figure are available on Github: https://github.com/benjaminjack/enzyme_distance/tree/master/figure_data.

