. 2016 May 3;5:e12190. doi: 10.7554/eLife.12190

Figure 1. Synaptic transmission is homeostatically regulated.

(A) Perforated patch-clamp on Xenopus neuron (N) and muscle cell (M) in primary culture. Presynaptic APs were triggered with current steps. Postsynaptic APs were recorded under current-clamp and nicotinic synaptic currents under voltage-clamp (-80 mV). (B) Intracellular recording in soleus muscle fibers from an adult mouse using a floating sharp electrode (see Materials and Methods and Figure 1—figure supplement 1). (C) Nicotinic conductance calculated from averaged ePSCs (n = 30 ePSCs for each dot) in different Xenopus muscle cells as a function of their input conductance. The black line shows the linear regression. (D) In mice, membrane potential reached by the ePSP in individual FDB muscle fibers after treatment with µ-conotoxin GIIIB, in absence of burst stimulation of the nerve (black dots, n= 88 fibers, 2 muscles, 2 mice), and in test preparations (grey dots, n = 108 fibers, 2 muscles, 2 mice) for which the nerve was burst stimulated prior to conotoxin treatment (15 bursts in 10 min, each of 120 events at 30 Hz). (E) Mean synaptic gain at Xenopus synapses (dots, n = 5 synaptic connections) and in mouse neuromuscular junctions (squares, n = 4 muscle fibers from different mice) during chronic bursts of presynaptic stimulation (bursts of 80 to 120 pulses, 30 Hz for 30 min).

DOI: http://dx.doi.org/10.7554/eLife.12190.003

Figure 1.

Figure 1—figure supplement 1. Floating electrode.

Figure 1—figure supplement 1.

In conventional electrophysiology, an intracellular electrode made from pulled glass is rigidly fixed to an amplifier headstage and/or to the micromanipulator by a holder preventing free movements. To allow intracellular recordings in contracting mouse muscle, we cut off the tip of the pipette and used this as an electrode connected to the amplifier headstage by a loose, 5–10 cm length 50 µm diameter silver wire (see Materials and methods). The lower trace shows the force developed by the muscle during a train of nerve stimulations with a frequency close to the tetanus. The contraction force was measured with a FT03 force transducer from Grass Technologies (Astro-Med Inc., West Warwick) and expressed in Newton. The middle trace shows a single muscle cell recording of the membrane potential with the floating electrode technique. The upper trace shows a detail view of the ePSPs and action potentials.

Figure 1—figure supplement 2. Mouse muscles fibers have a wide range of input conductances.

Figure 1—figure supplement 2.

Input conductances (G) of muscle fibers were calculated from the depolarization induced by injection of a positive current and application of Ohm’s law. The histogram represents the normalized count distribution of the input conductances for 33 fibers in an Extensor Digitorum Longus muscle, for 34 fibers in a Flexor Digitorum Brevis muscle, and for 50 fibers in a Soleus muscle. Data were binned with a step increment of 0.2 µS.

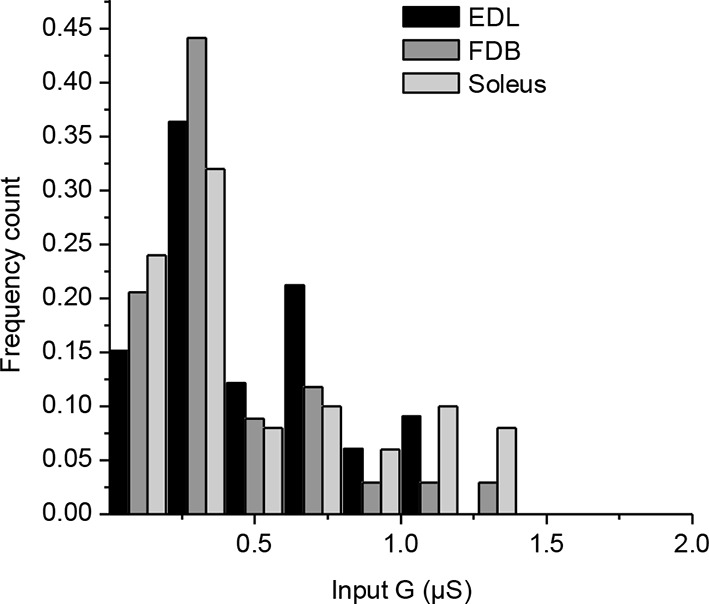
Figure 1—figure supplement 3. Characterization of the K+ conductances that determine the Xenopus muscle cell input conductance.

Figure 1—figure supplement 3.

(A) A K+ inward rectifying (Kir) conductance dominates the input conductance of Xenopus muscle cells. The upper panel shows membrane currents recorded under voltage-clamp during ramp potentials (125 mV/s), in control conditions (grey trace) and after addition of external Ba2+ 300 µM (black trace). The Kir component, sensitive to external Ba2+, was obtained by the difference between the two traces. The lower panel shows the isolated Kir conductance (gray trace) and the remaining conductances in presence of Ba2+ (black trace), composed of a passive K+ leak conductance and of the voltage-activated K+ (Kv) conductances. The Kir conductance dominates the input conductance around the resting potential, decreases with depolarization and becomes null at the excitability threshold. (B) A linear correlation between the Kir current and the membrane capacitance (an estimation of the surface) of the cells reveals the strong homogeneity of the membrane conductance density in the cells culture, and emphasizes the wide range of input conductances and excitabilities found in muscle cells (i.e. an increase of surface with constant leak density implies an increase in the input conductance, and a decrease in excitability).