. 2016 Apr 12;5:e13446. doi: 10.7554/eLife.13446

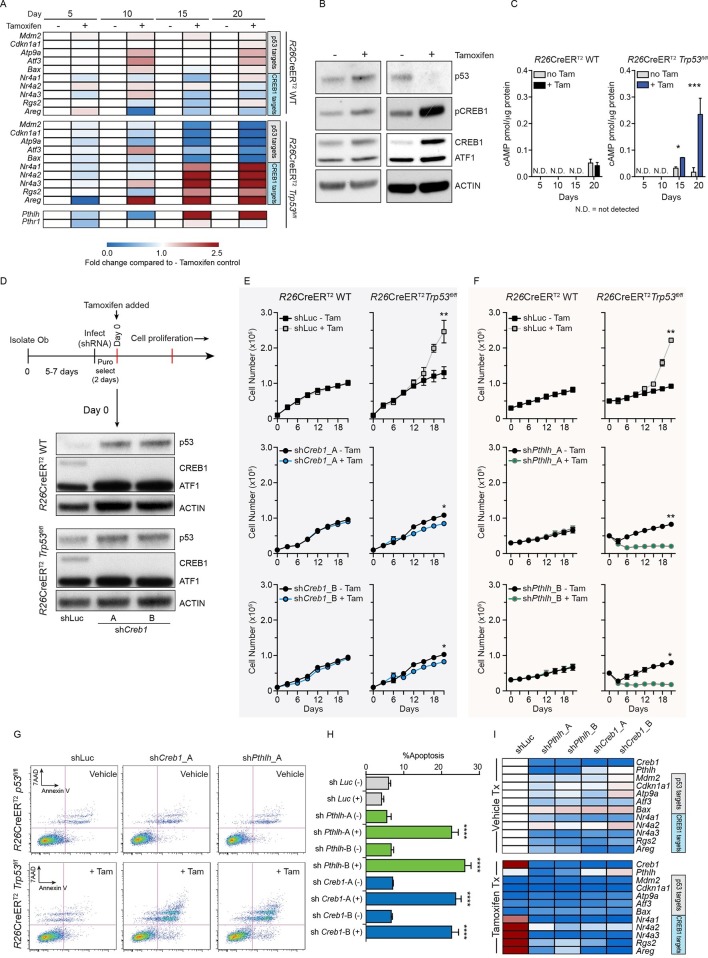
Figure 1. Intact PTHrP and CREB1 are necessary for hyperproliferation of p53-deficient primary osteoblasts.

(A) Heat map of qPCR data. Expression of the PTHrP/CREB1 and p53 target genes between indicated cell types. Data from >3 independent cell lines for each, expressed as fold change relative to non-tamoxifen treated isogenic culture. (B) Western blot of p53, pCREB1 and CREB1, β-ACTIN used as a loading control. Data representative of 2–3 independent cell lines from each. (C) Quantification of cAMP levels (+IBMX) in the R26-CreERT2p53+/+ (vehicle and tamoxifen treated) and R26-CreERT2p53fl/fl vehicle and tamoxifen treated (p53△/△) primary osteoblasts, and day 5, 10, 15 and 20 days post tamoxifen. Data from 2 R26-CreERT2p53+/+ and 4 R26-CreERT2p53fl/fl independent cultures; mean ± SEM. (D) Experimental outline for proliferation assay; Western blot of p53, pCREB1 and CREB1 in indicated cell types, β-ACTIN used as a loading control at Day 0 of culture. Proliferation assays performed in the indicated genotype post CREB1 (E) and PTHrP (F) knockdown with tamoxifen treatment commencing at day 0; shLuc = control shRNA; Data from 4 independent R26-CreERT2p53fl/fl and 2 R26-CreERT2p53+/+ cultures; mean ± SEM and statistics = area under the curve across the time course. (G) AnnexinV/7-AAD profiles of R26-CreERT2p53fl/fl +/- tamoxifen treatment infected with control (shLuc), shCreb1_A or shPthlh_A. (H) Percent apoptotic cells in each culture +/- tamoxifen. (I) Heat map of qPCR data. Expression of the p53 and PTHrP/CREB1 target genes between cell types; 3 independent cell cultures for each condition. Data expressed as mean ± SEM (n=3). For all panels: *p<0.05, **p<0.01, ***p<0.001. See Figure 1—figure supplement 1 and Figure 1—figure supplement 2.

DOI: http://dx.doi.org/10.7554/eLife.13446.003

Figure 1.

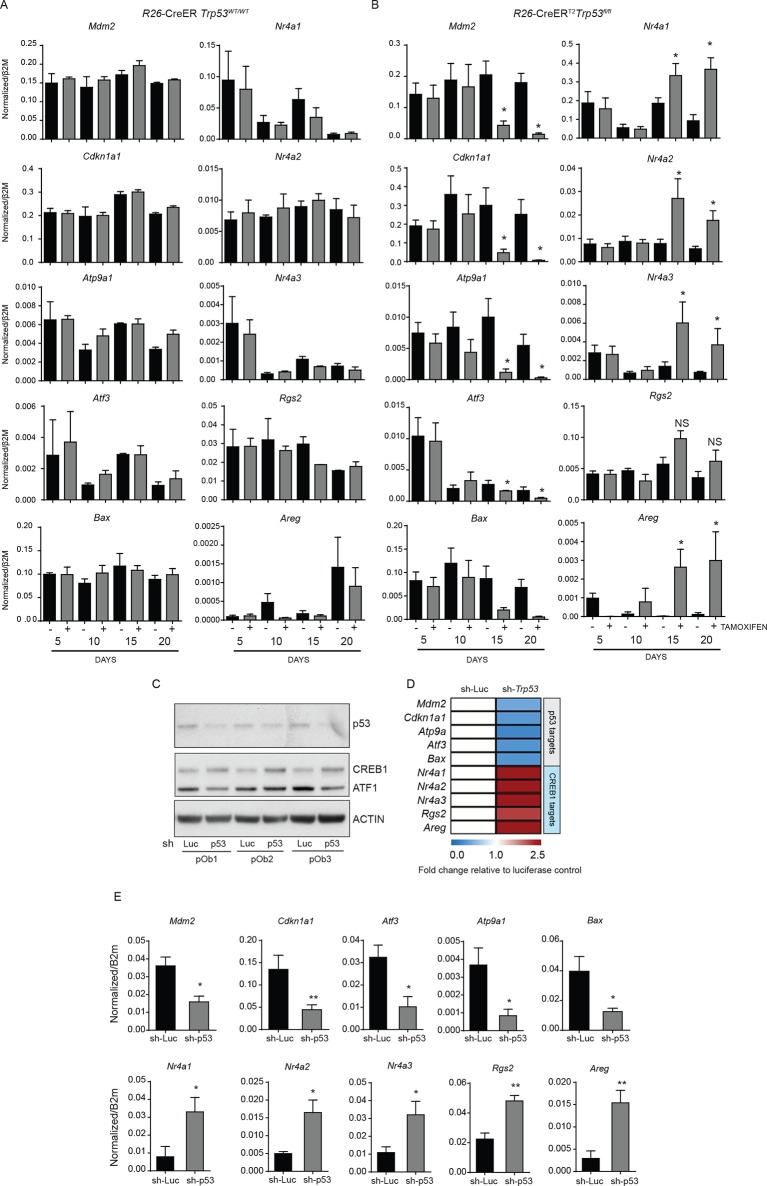
Figure 1—figure supplement 1. Expression of p53 and PTHrP/CREB1 target genes in R26-CreER p53+/+ and R26-CreER p53fl/fl cultures +/- tamoxifen.

Figure 1—figure supplement 1.

(A) Expression of p53 (Mdm2, Cdkn1a1, Atp9a1, Atf3, Bax) and PTHrP/CREB1 (Nr4a1, Nr4a2, Nr4a3, Rgs2, Areg) target genes at the indicated time points +/- tamoxifen in WT (R26-CreER p53+/+) primary osteoblast cultures (n=2 independent cultures). (B) Expression of p53 (Mdm2, Cdkn1a1, Atp9a1, Atf3, Bax) and PTHrP/CREB1 (Nr4a1, Nr4a2, Nr4a3, Rgs2, Areg) target genes at the indicated time points +/- tamoxifen in p53 deficient (R26-CreER p53fl/fl) primary osteoblast cultures (n=4 independent cultures). QPCR data normalized to β2m, for all the experiments above Students t-test was used, *p<0.05. (C) Expression of p53, CREB1, ATF1 and ACTIN after infection with a control (sh-Luc) or p53 targeting shRNA in primary long bone osteoblasts. (D) Expression of p53 (Mdm2, Cdkn1a1, Atp9a1, Atf3, Bax) and PTHrP/CREB1 (Nr4a1, Nr4a2, Nr4a3, Rgs2, Areg) target genes at the indicated time points 48 hr after selection of cells infected with control (sh-Luc) or p53 targeting shRNA (n=3 independent cultures). qPCR data normalized to β2m. (E) Raw data normalized to β2m, for data in panel D; Students t-test was used, *p<0.05..
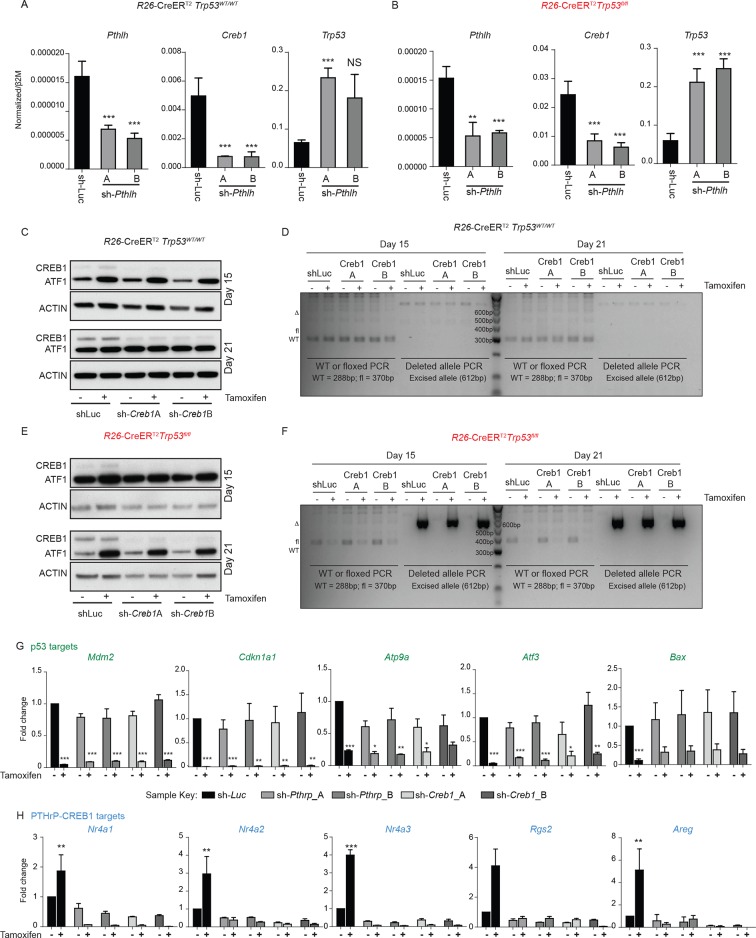
Figure 1—figure supplement 2. Effects of shRNA against Pthrp and Creb1 in R26-CreER p53+/+ and R26-CreER p53fl/fl cultures +/- tamoxifen.

Figure 1—figure supplement 2.

(A) Expression of Pthlh, Creb1 and p53 in WT (R26-CreER p53+/+) primary osteoblast cultures (n=2 independent cultures) at Day 0. (B) Expression of Pthlh, Creb1 and p53 in p53 deficient (R26-CreER p53fl/fl) primary osteoblast cultures (n=4 independent cultures) at Day 0 of tamoxifen addition. (C) Expression of CREB1 and p53 at Day 15 and 21 in WT (R26-CreER p53+/+) primary osteoblast cultures (n=2 independent cultures). (D) Genomic PCR for p53 locus at Day 15 and 21 in WT (R26-CreER p53+/+) primary osteoblast cultures (n=2 independent cultures). (E) Expression of CREB1 and pCREB1 at Day 15 and 21 in p53 deficient (R26-CreER p53fl/fl) primary osteoblast cultures (n=4 independent cultures). (F) Genomic PCR for p53 locus at Day 15 and 21 in p53 deficient (R26-CreER p53fl/fl) primary osteoblast cultures (n=4 independent cultures). (G) Expression of p53 target genes and (H) PTHrP/CREB1 target genes 72 hrs after infection of isogenic p53 deficient (R26-CreER p53fl/fl) +/- tamoxifen primary osteoblast cultures at day 21 post tamoxifen/vehicle addition (n=3 independent cultures). Data expressed as fold change relative to shLuc vehicle control cultures. qPCR data normalized to β2m, for all the experiments above Students t-test was used, *p<0.05, **p<0.001, ***p<0.0001.