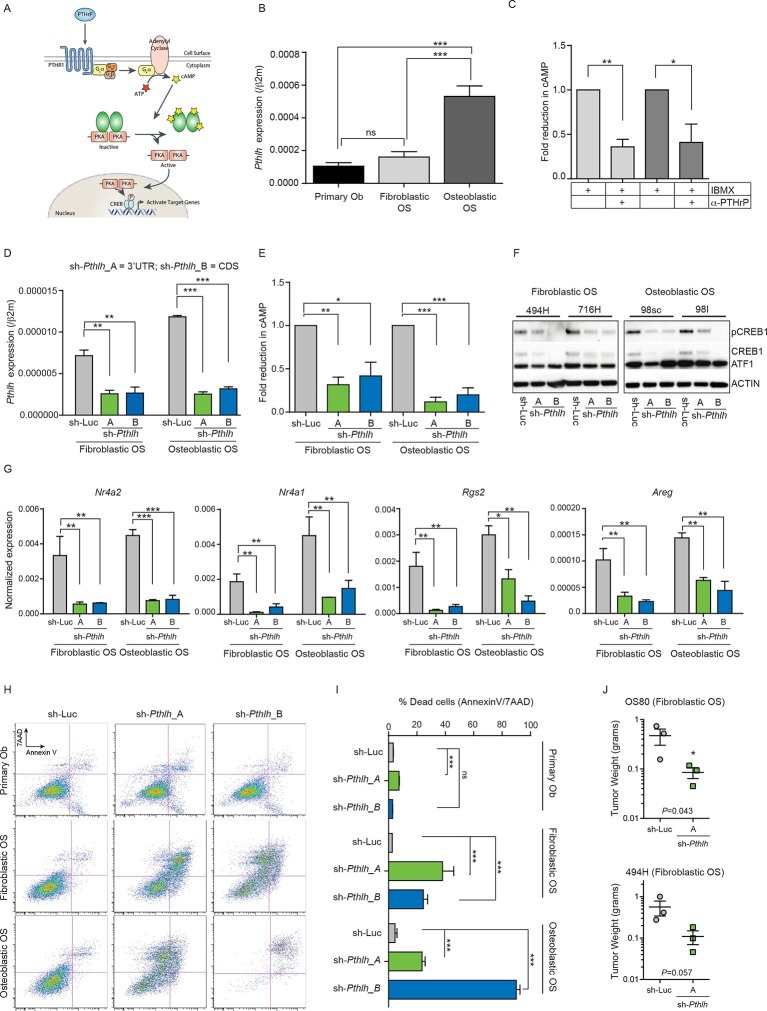
Figure 2. Cell autonomous stimulation of cAMP by PTHrP in OS.
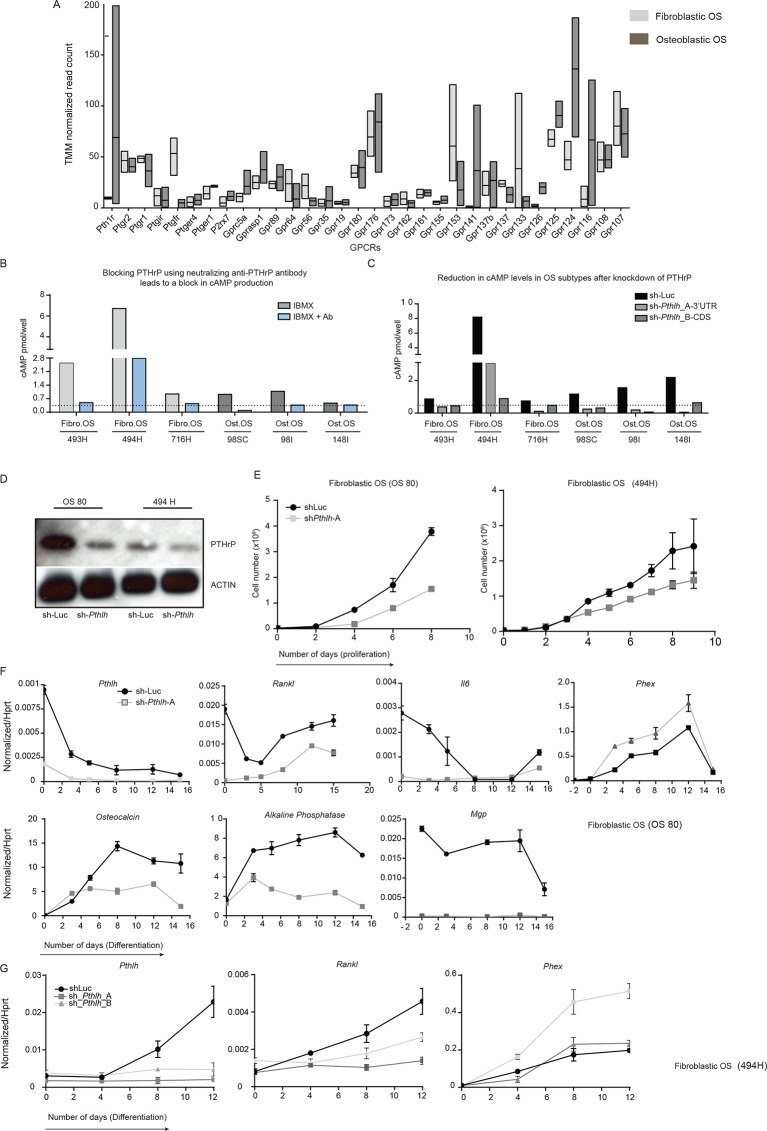
(A) Cartoon of PTHrP-PTHR1-cAMP-CREB1 axis. (B) qPCR expression of Pthlh normalized to β2m; mean ± SEM (n=3). (C) cAMP levels after anti-PTHrP antibody treatment for fibroblastic OS (light grey) and osteoblastic OS (dark grey). Expressed as normalized mean cAMP ± SEM ((n=3/subtype). (D) Knockdown of Pthlh transcript using 2 independent shRNA (A and B) in indicated OS subtypes. Data normalized to β2m, expressed as mean ± SEM (n=3/subtype). (E) Fold reduction of cAMP levels in sh-Pthlh infected OS subtype cells. IBMX in all treatments, data displayed as normalized mean cAMP ± SEM (n=3/subtype). The data is the mean of 3 independent cell cultures for each subtype. (F) pCREB1/CREB1 protein levels following knockdown of PTHrP. Pan-ACTIN/ATF-1 used as a loading control. Data are representative of 2 independent cell cultures from each OS subtype. (G) Expression of indicated CREB1 target gene transcripts following Pthlh knockdown. Means ± SEM (n=3/subtype). (H) AnnexinV/7-AAD staining of indicated cells following infection with two independent sh-Pthlh (A and B) or sh-Luc control. (I) Quantitation of dead cells in indicated cell type. The data represents 3 independent cell cultures for each type, mean ± SEM (n=3). *p<0.05, **p<0.001, ***p<0.0001. (J) In vivo bilateral grafts of independent fibrobastic OS lines OS80 and 494H with control (sh-Luc) on one flank and sh-Pthlh_A on the other flank. Data expressed as mean weight ± SEM (n=3 tumours per shRNA per cell line; performed once); P value as indicated. See Figure 2—figure supplement 1 and Figure 2—figure supplement 2.


