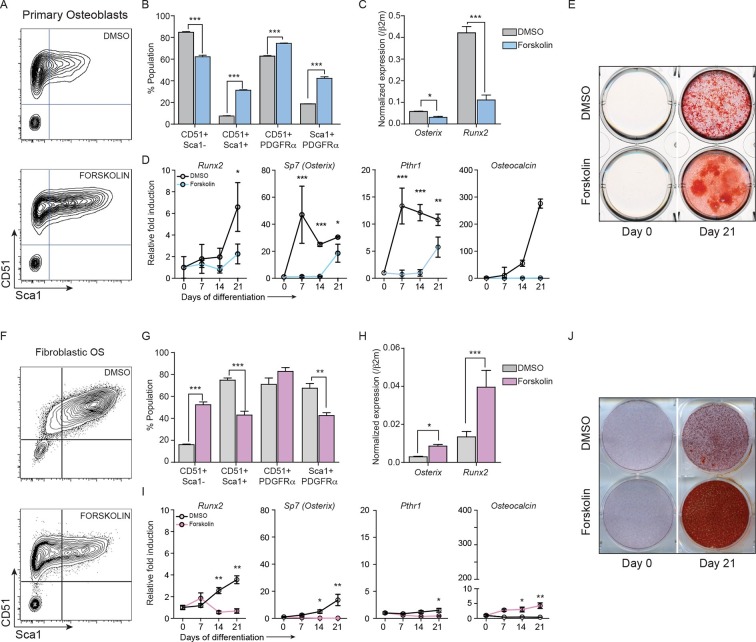
Figure 4. Constitutively elevated cAMP differentially affects primary osteoblasts and osteosarcoma cells.
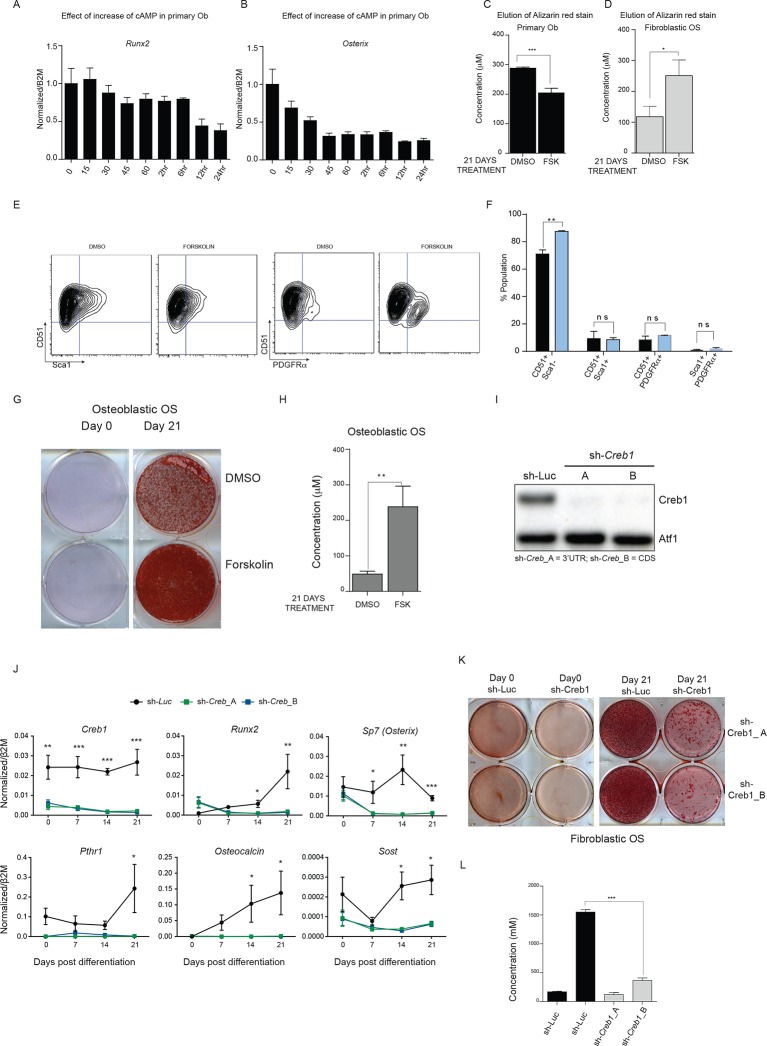
(A) Primary osteoblasts treated with DMSO or forskolin for 72 hr and assessed for expression of Sca-1, CD51, PDGFRα , representative results shown, n=3 independent experiments. (B) Quantitation of cell surface markers from each treatment (n=3 independent cultures) (C) Expression of Sp7 (Osterix) and Runx2 by qPCR after 72 hr of forskolin treatment. Expression levels normalized to β2m; mean ± SEM (n=3). (D) Expression level of indicated genes over 21 days of treatment with DMSO or forskolin. Expression normalized to β2m; mean ± SEM (n=3). (E) Mineralisation analysis of primary osteoblasts at day 21 after treatment. Images are representative of 3 independent experiments. (F) Fibroblastic OS cells were treated with DMSO or forskolin for 72 hr and assessed for expression of Sca-1, CD51, PDGFRα, representative results shown. (G) Quantitation of cell surface markers from (n=3 independent cultures of fibroblastic OS) from each treatment. (H) Expression of Sp7 (Osterix) and Runx2 in fibroblastic OS by qPCR following 72 hr treatment. Expression levels normalized to β2m; mean ± SEM (n=3). (I) Expression of indicated genes in fibroblastic OS over 21 days from each treatment. Expression normalized to β2m; mean ± SEM (n=3). (J) Representative images of alizarin red stained fibroblastic OS cells treated with DMSO or forskolin for 21 day; n=3 independent OS cultures; *p<0.05, **p<0.001, ***p<0.0001. See Figure 4—figure supplement 1 and Figure 4—figure supplement 2.


