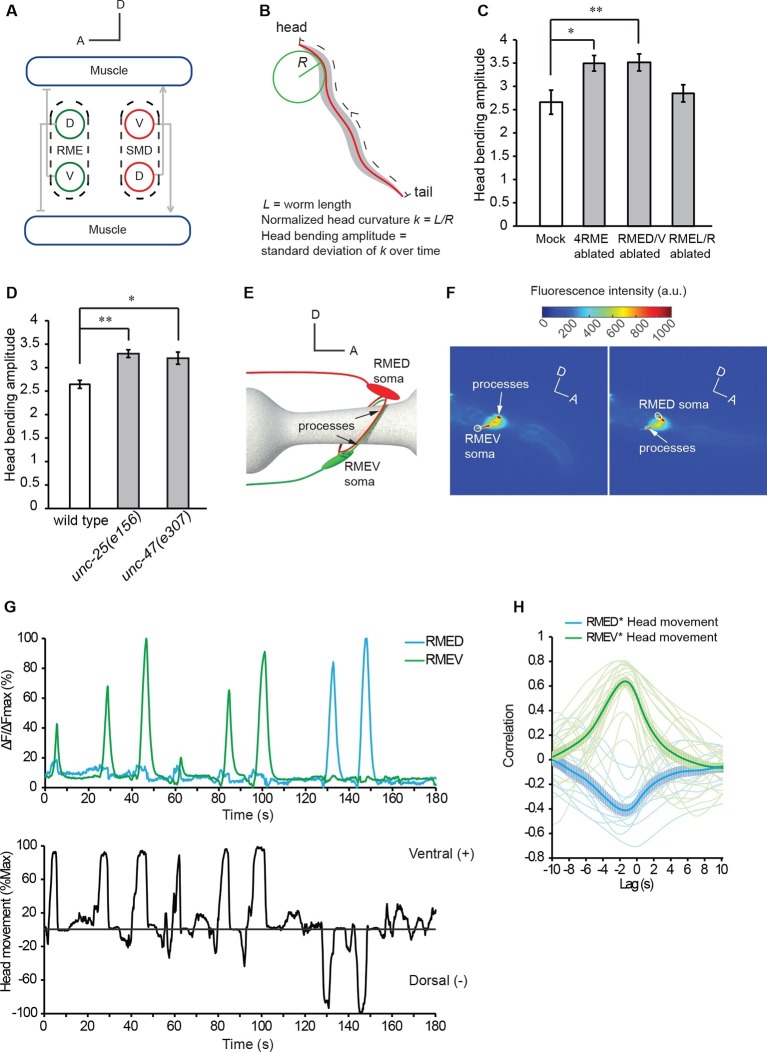
Figure 1. The GABAergic motor neurons RME restrict head bending amplitude and exhibit intracellular calcium signals that are correlated with head bending.
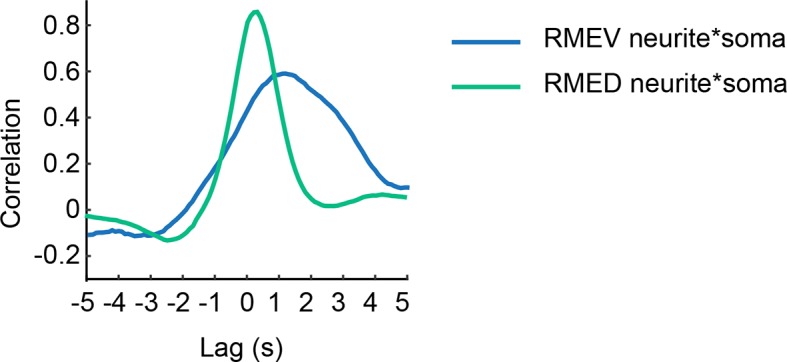
(A) Schematics showing the innervation of anterior muscles by RME and SMD motor neurons. Note that the cell bodies (denoted by circles) of RMEV (V) and SMDD (D) are located on the ventral side and the cell bodies (denoted by circles) of RMED (D) and SMDV (V) are located on the dorsal side. RME and SMD neurons innervate the muscles that are contralateral to the position of their cell bodies. Arrows denote excitatory synapses and blunt-ended lines denote inhibitory synapses. Only the muscles and motor neurons on the left-side are shown (White et al., 1986). A, anterior; D, dorsal. (B) Schematics showing the method of quantifying the amplitude of head bending, which is defined as the standard deviation of head curvature along the first ~18% of the worm body over the time lapse of measurement (Materials and methods). (C) Ablating all 4 RME neurons or the dorsal and ventral RME (RMED/V) increases head bending amplitude, but ablating only the left and right RME neurons (RMEL/R) does not have an effect. (D) The unc-25(e156) and unc-47(e307) mutant animals exhibit increased head bending amplitude. For C and D, One-way ANOVA with Dunnett’s post-test, **p<0.01, *p<0.05, n ≥ 9 animals each, bar graphs indicate mean values and error bars indicate SEM. (E, F) Schematics showing the positions of RMED/V cell bodies and processes (E) and single frames of GCaMP3 fluorescence signals in RMED and RMEV (F). A, anterior; D, dorsal; a.u., arbitrary unit. (G) Sample GCaMP3 signals in RMEV and RMED neurons and the corresponding head bending in the same animal. Figure 1—figure supplement 1. shows samples of cross-correlation between the calcium transients in the cell body and neurite of a RMED neuron or a RMEV neuron. (H) Cross-correlation between RMEV or RMED GCaMP3 signal and head bending. Faint lines indicate the results from individual animals and the thick lines indicate mean value.
Figure 1—figure supplement 1. Sample cross-correlation between the GCaMP3 signal in the cell body and the GCaMP3 signal in the neurite of a RMEV or a RMED neuron.


