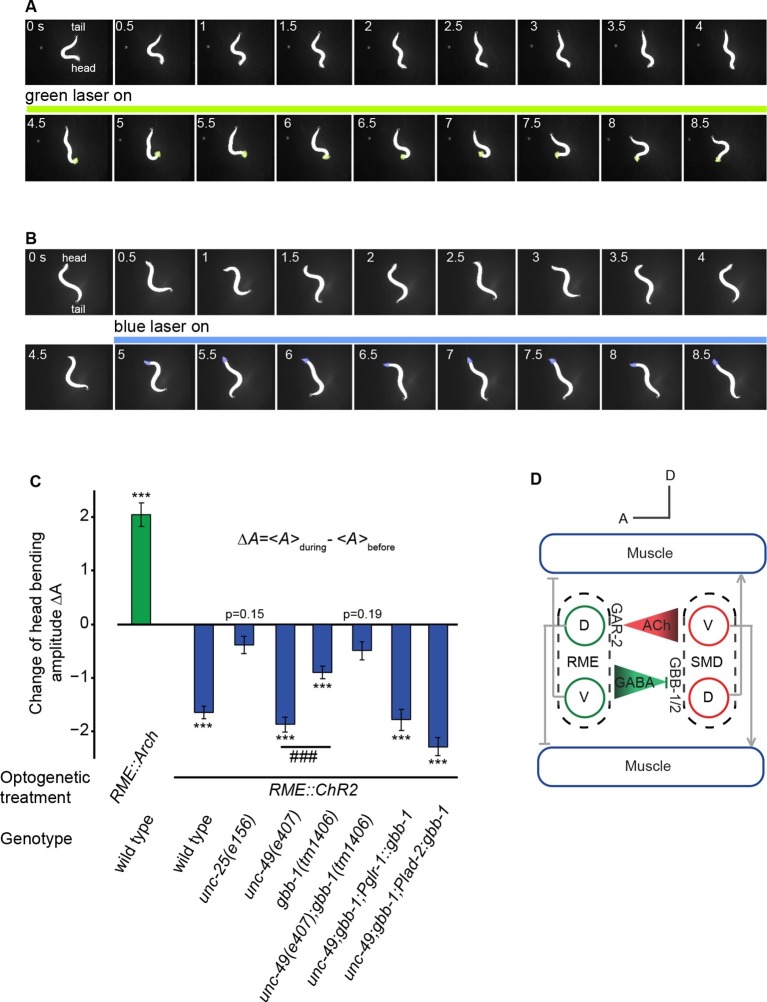
Figure 6. The activity of the RME GABAergic neurons is causally linked with head bending amplitude.
(A) Video images of locomotory behavior before and during green light illumination in a worm that expresses Arch in RME neurons. The illuminated head region is highlighted in green. (B) Video images of locomotory behavior before and during blue light illumination in a worm that expresses ChR2 in RME neurons. The illuminated head region is highlighted in blue. (C) Quantification of optogenetic effects on head bending amplitude in wild type, mutants and transgenic animals that express a wild-type gbb-1 cDNA under the glr-1 or lad-2 promoters in unc-49;gbb-1 background. Sample size: RME::Arch in wild type (n = 25 trials, 15 animals), RME::ChR2 in wild type (n = 98 trials, >20 animals), RME::ChR2 in unc-25(e156) (n = 63 trials, 14 animals), RME::ChR2 in unc-49(e407) (n = 85 trials, 17 animals), RME::ChR2 in gbb-1(tm1406) (n = 81 trials, 11 animals), RME::ChR2 in unc-49(e407); gbb-1(tm1406) (n = 83 trials, 6 animals), RME::ChR2 in unc-49(e407); gbb-1(tm1406); Pglr-1::gbb-1 (n = 51 trials, 7 animals), RME::ChR2 in unc-49(e407); gbb-1(tm1406); Plad-2::gbb-1(n = 90 trials, 9 animals). For each trial, we calculate the change of the head bending amplitude during and before optogenetic manipulation of RME with sign test for zero median, ***p<0.0001; unc-49(e407) and gbb-1(tm1406) are compared with Mann-Whitney U test, ###p<0.0001; Mean ± SEM; while similar effects were usually observed in more than one transgenic lines, the effect of each transgene is reported with the results from one transgenic line. (D) A schematic model for the mechanisms underlying RME GABAergic neuromodulatory function.

