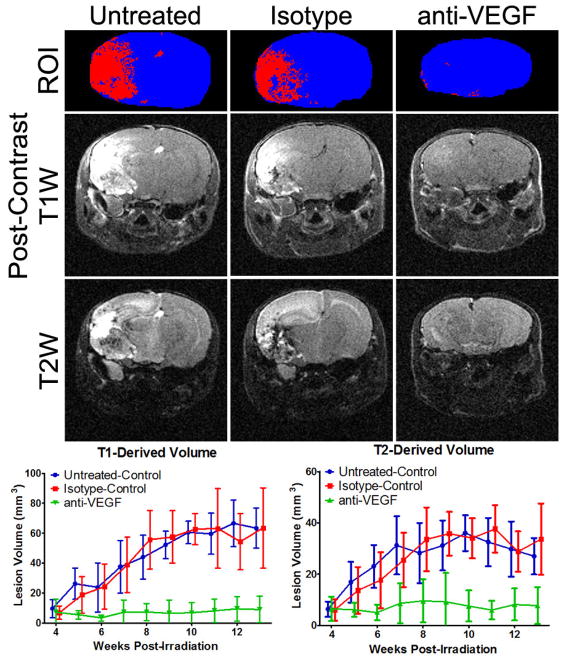
Figure 1.
Treatment with anti-VEGF antibodies is VEGF specific. At the top are representative T1-based segmentations (blue is brain, red is lesion), and post-contrast T1 and T2-weighted images at 13 weeks post irradiation for the three groups: untreated control, isotype-matched antibody treatment, and anti-VEGF antibody treatment. The lesion is bright in these images. Note the lack of obvious lesion and the reduced brain size (reduced swelling) in the anti-VEGF example. Below the images are the T1 and T2-derived volumes (mean ± SD) for the three groups. The anti-VEGF treated animals had significantly smaller lesions for both methodologies from week 7 to week 13 PIR as determined by 2-Way ANOVA with Bonferroni post tests (n = 5 – 9).

