Figure 2.
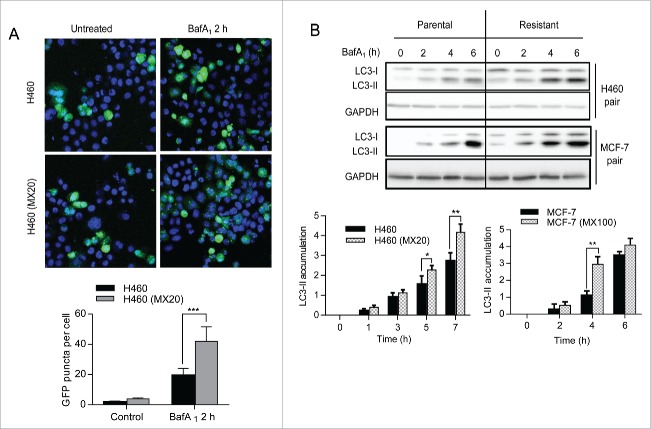
ABCG2-expressing drug-resistant cells have higher basal levels of autophagy. (A) H460 and H460 (MX20) cells were transiently transfected with a GFP-LC3 plasmid prior to 2 h of BafA1 (20 nM) treatment. Confocal fluorescence microscopic images of green-fluorescent GFP-LC3 were captured and LC3 puncta were quantified and graphed (shown below). Results (mean ± SD) are the average of counts from 25 randomly selected cells for each cell line. (B) Levels of LC3-II in parental and resistant cells were analyzed by western blot after treatment with BafA1. Quantification of LC3-II levels normalized to GAPDH is shown graphically (below).

