
Figure 3.
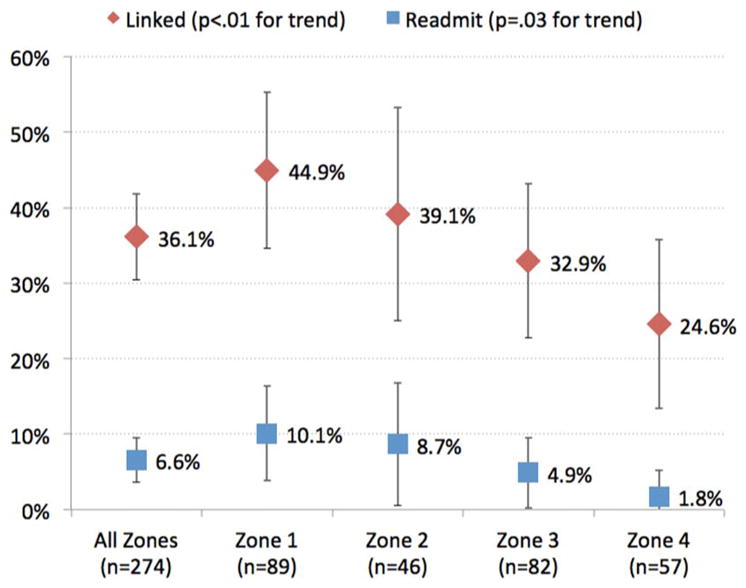
Proportion of patients linked to care (diamond) and readmitted (square) by zone. 95% CI bars are shown. Two-sided p values for Cochran–Armitage trend test across zones 1–4 are shown.
Official websites use .gov
A
.gov website belongs to an official
government organization in the United States.
Secure .gov websites use HTTPS
A lock (
) or https:// means you've safely
connected to the .gov website. Share sensitive
information only on official, secure websites.
Proportion of patients linked to care (diamond) and readmitted (square) by zone. 95% CI bars are shown. Two-sided p values for Cochran–Armitage trend test across zones 1–4 are shown.