
Figure 3.
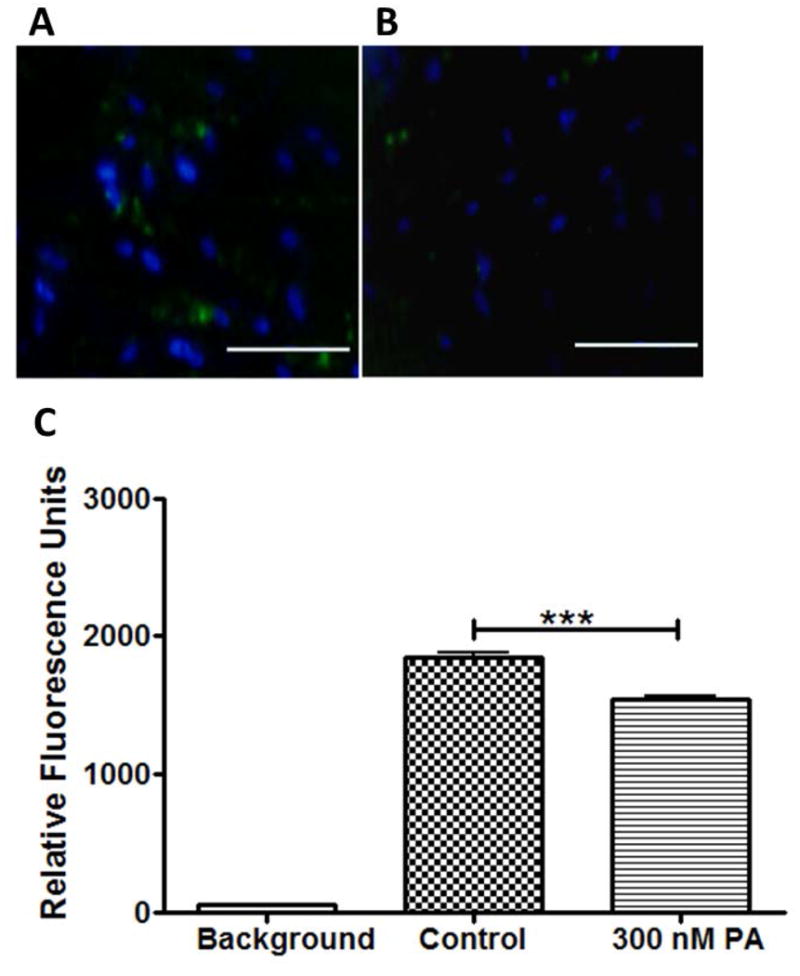
Inhibition of phagocytic activity of 3D HTM cultures after treatment with glucocorticoid. Confocal images of phagocytic 3D HTM of control cultures (A) and cultures treated with 300 nM PA for 3 days (B). Scale bar = 200 μm. (C) Quantitation of fluorescence analysis of phagocytic activity.