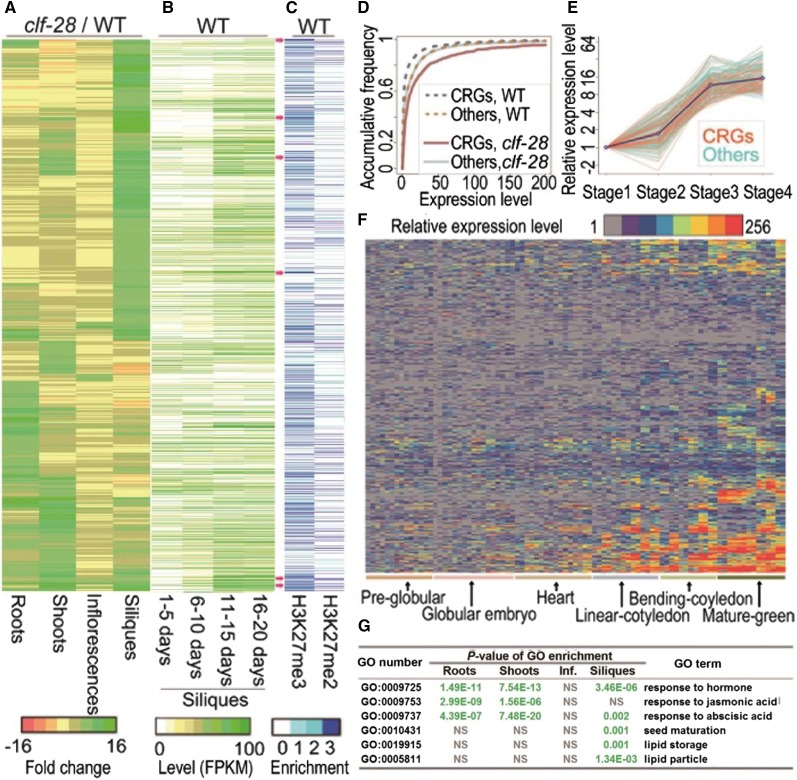
Figure 1.
Expression levels and histone modifications of CRGs. A, Expression changes (clf-28/wild type) of CRGs in four organs. Ratios of fragments mapped of assembled transcripts changes were used for clustering. Genes in A-C were shown in the same cluster order. B, Expression levels of CRGs in siliques at four different stages. C, Histone modifications on the genomic regions of CRGs in seedlings. Red arrows indicate some CRGs with high levels of H3K27me3 modifications. D, Distribution of expression of CRGs and other genes in siliques of wild type and clf-28. E, Relative expression levels of a gene cluster showing differential expression pattern at four different silique stages. Blue line shows average relative expression levels. F, Relative expression levels of CRGs in 42 embryonic compartments at six stages of seed development (Zuber et al., 2010). Samples were as described in Supplemental Data Set 1. Average expression levels in globular embryo were used as the reference for comparison (P-value of Empirical-Bayes t test < 0.01, fold-change cutoff > 8). (G) Representative GO enrichments of CRGs in four organs. “NS” means nonsignificant.

